All techniques
Framing & context
Spurious correlation
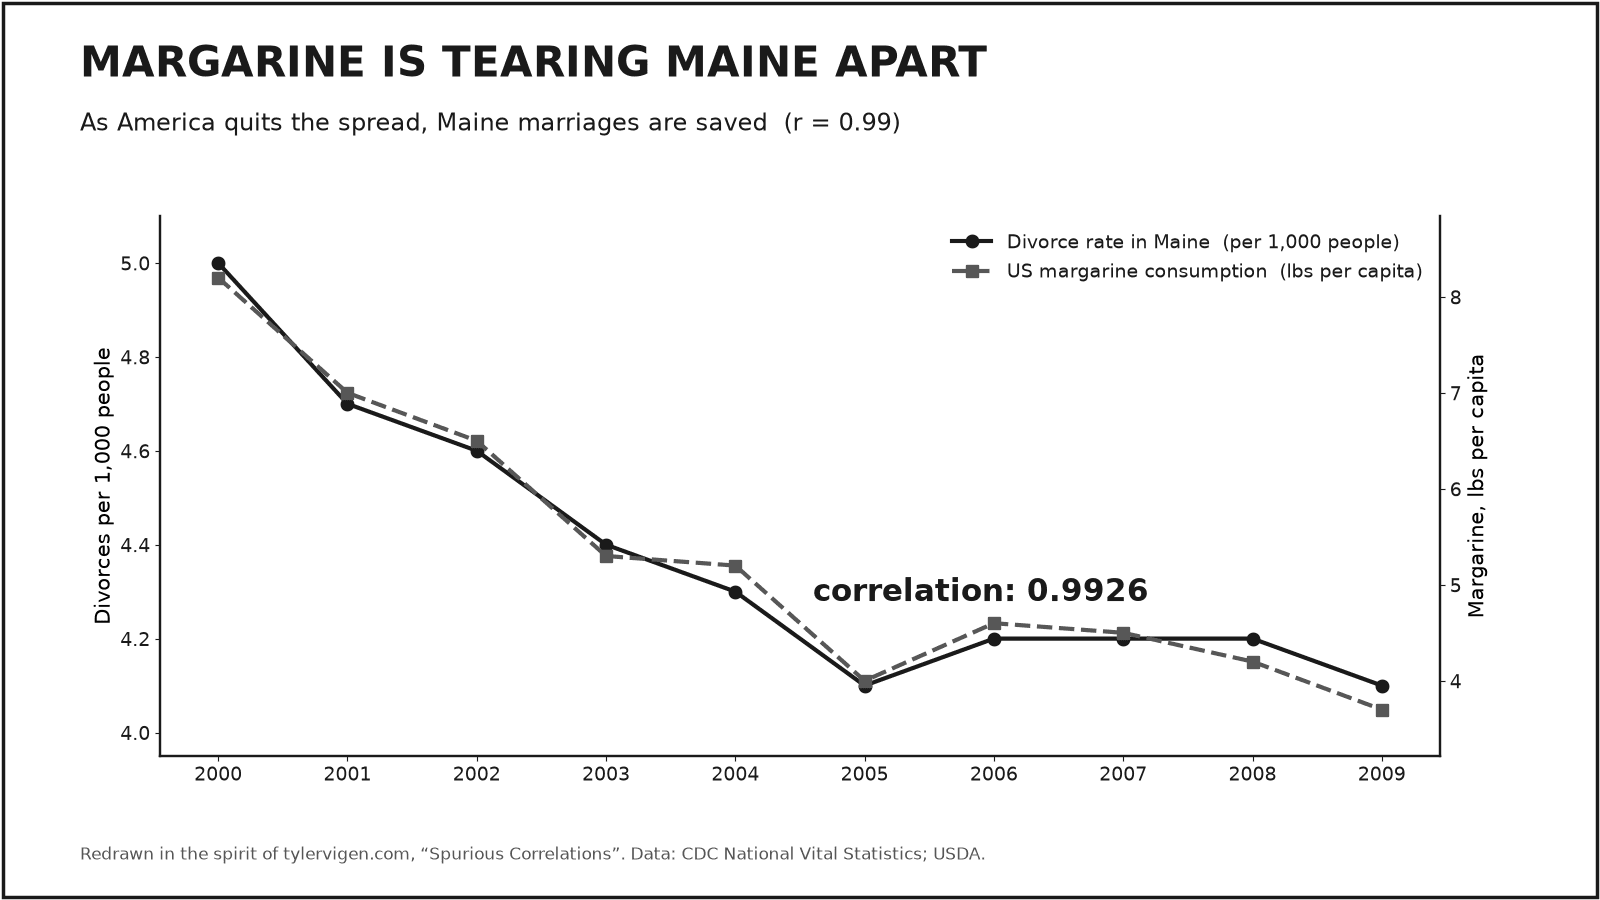
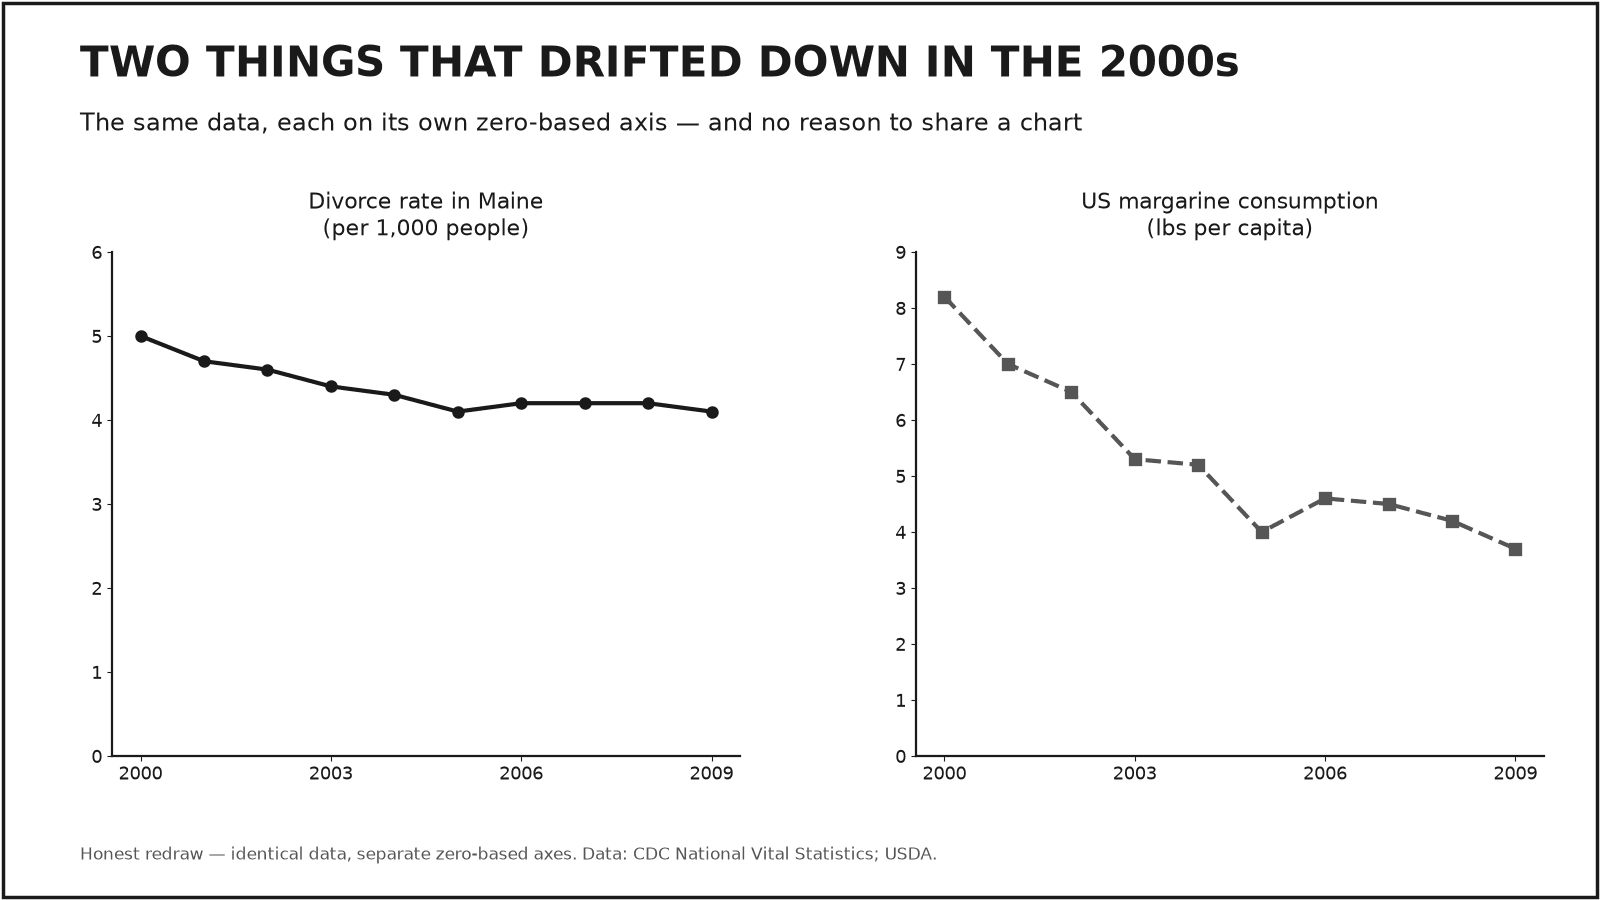
Margarine consumption and the divorce rate in Maine: a love story.
a.k.a. correlation ≠ causation
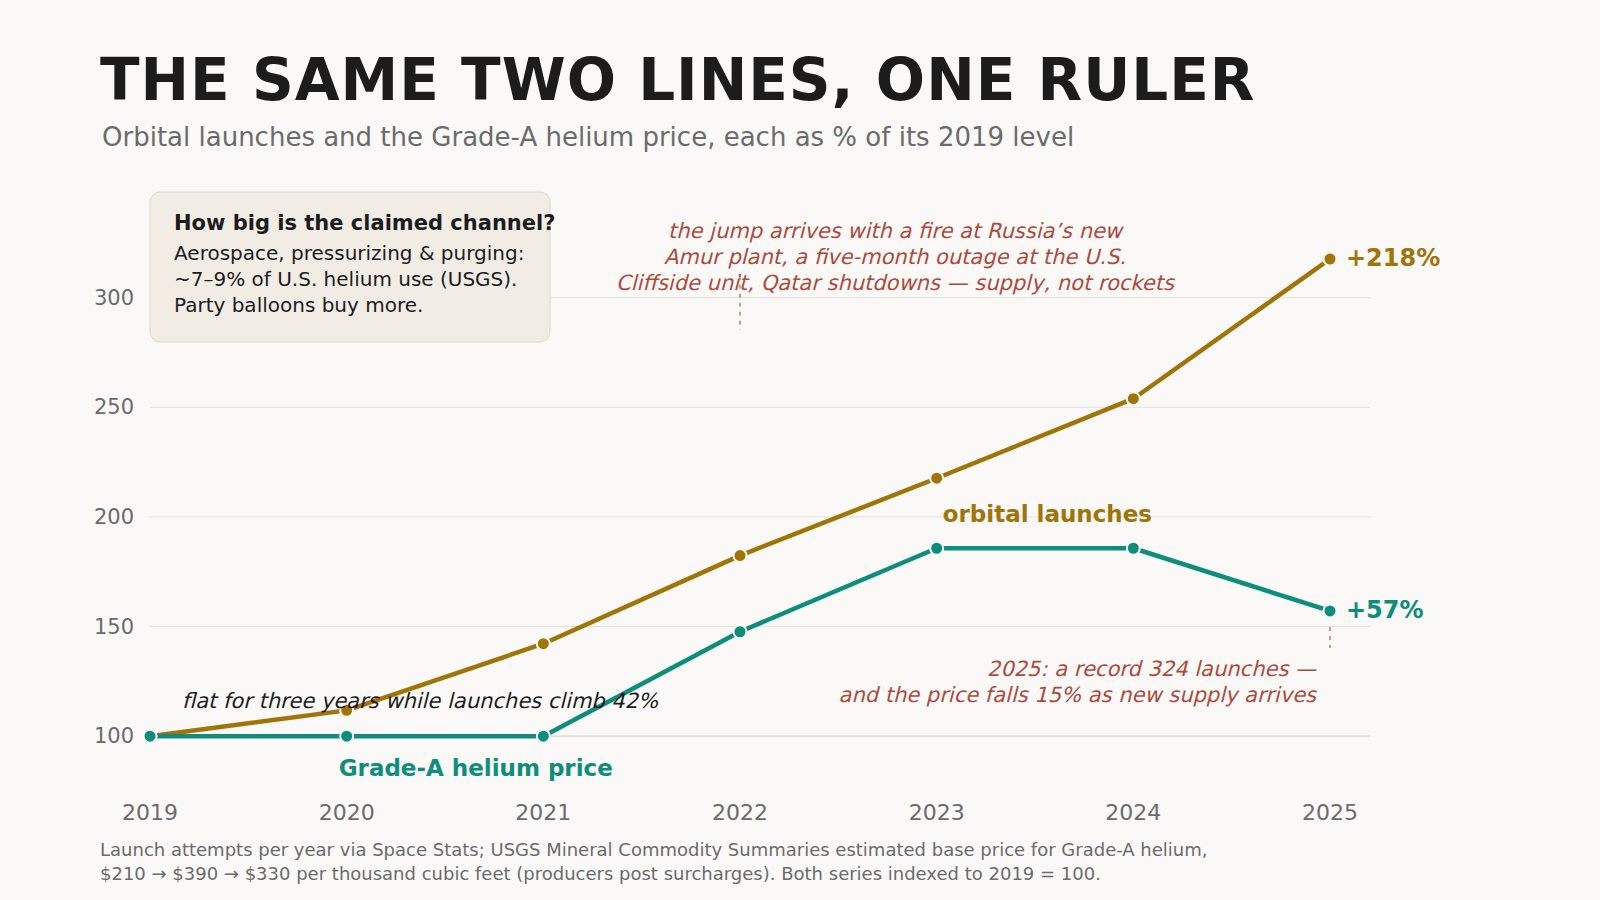
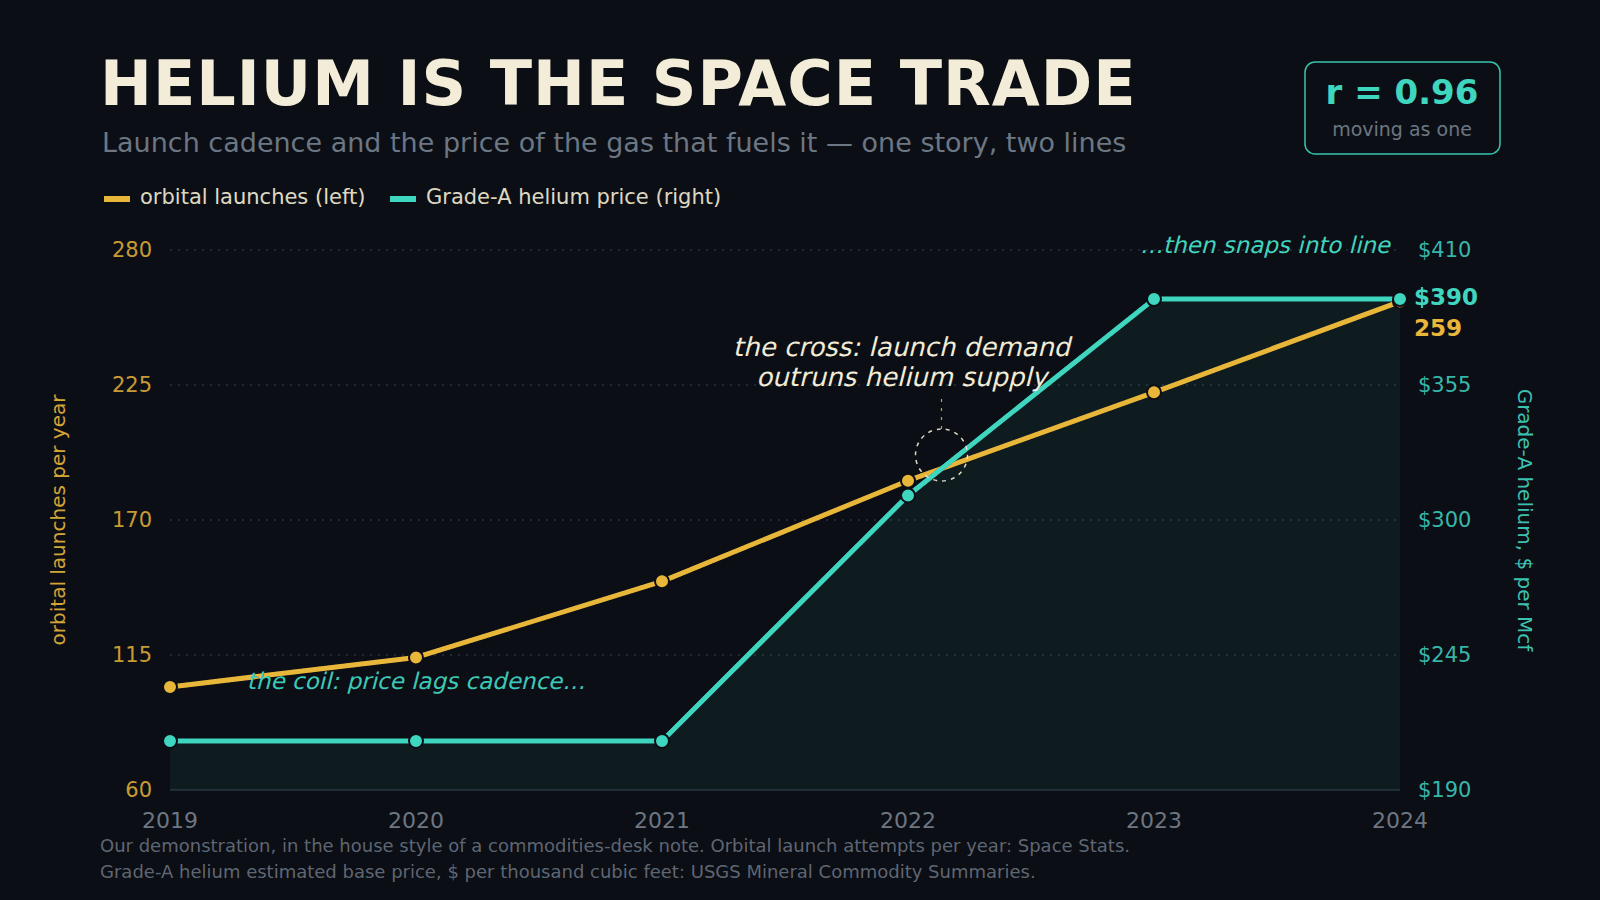
Comb through enough series and some will move together beautifully by pure chance — or because both quietly follow population, inflation, or time itself. A tight fit on a chart is not a mechanism.
How to spot it
- No plausible reason the two things should be linked.
- Both series simply trend upward over time. Most things do.
- Dual y-axes doing the heavy lifting in the background.
The fix
Ask what would have to be true for A to cause B, then check the confounders. Enjoy the coincidence; don’t publish it.