All techniques
Axis crimes
The log scale
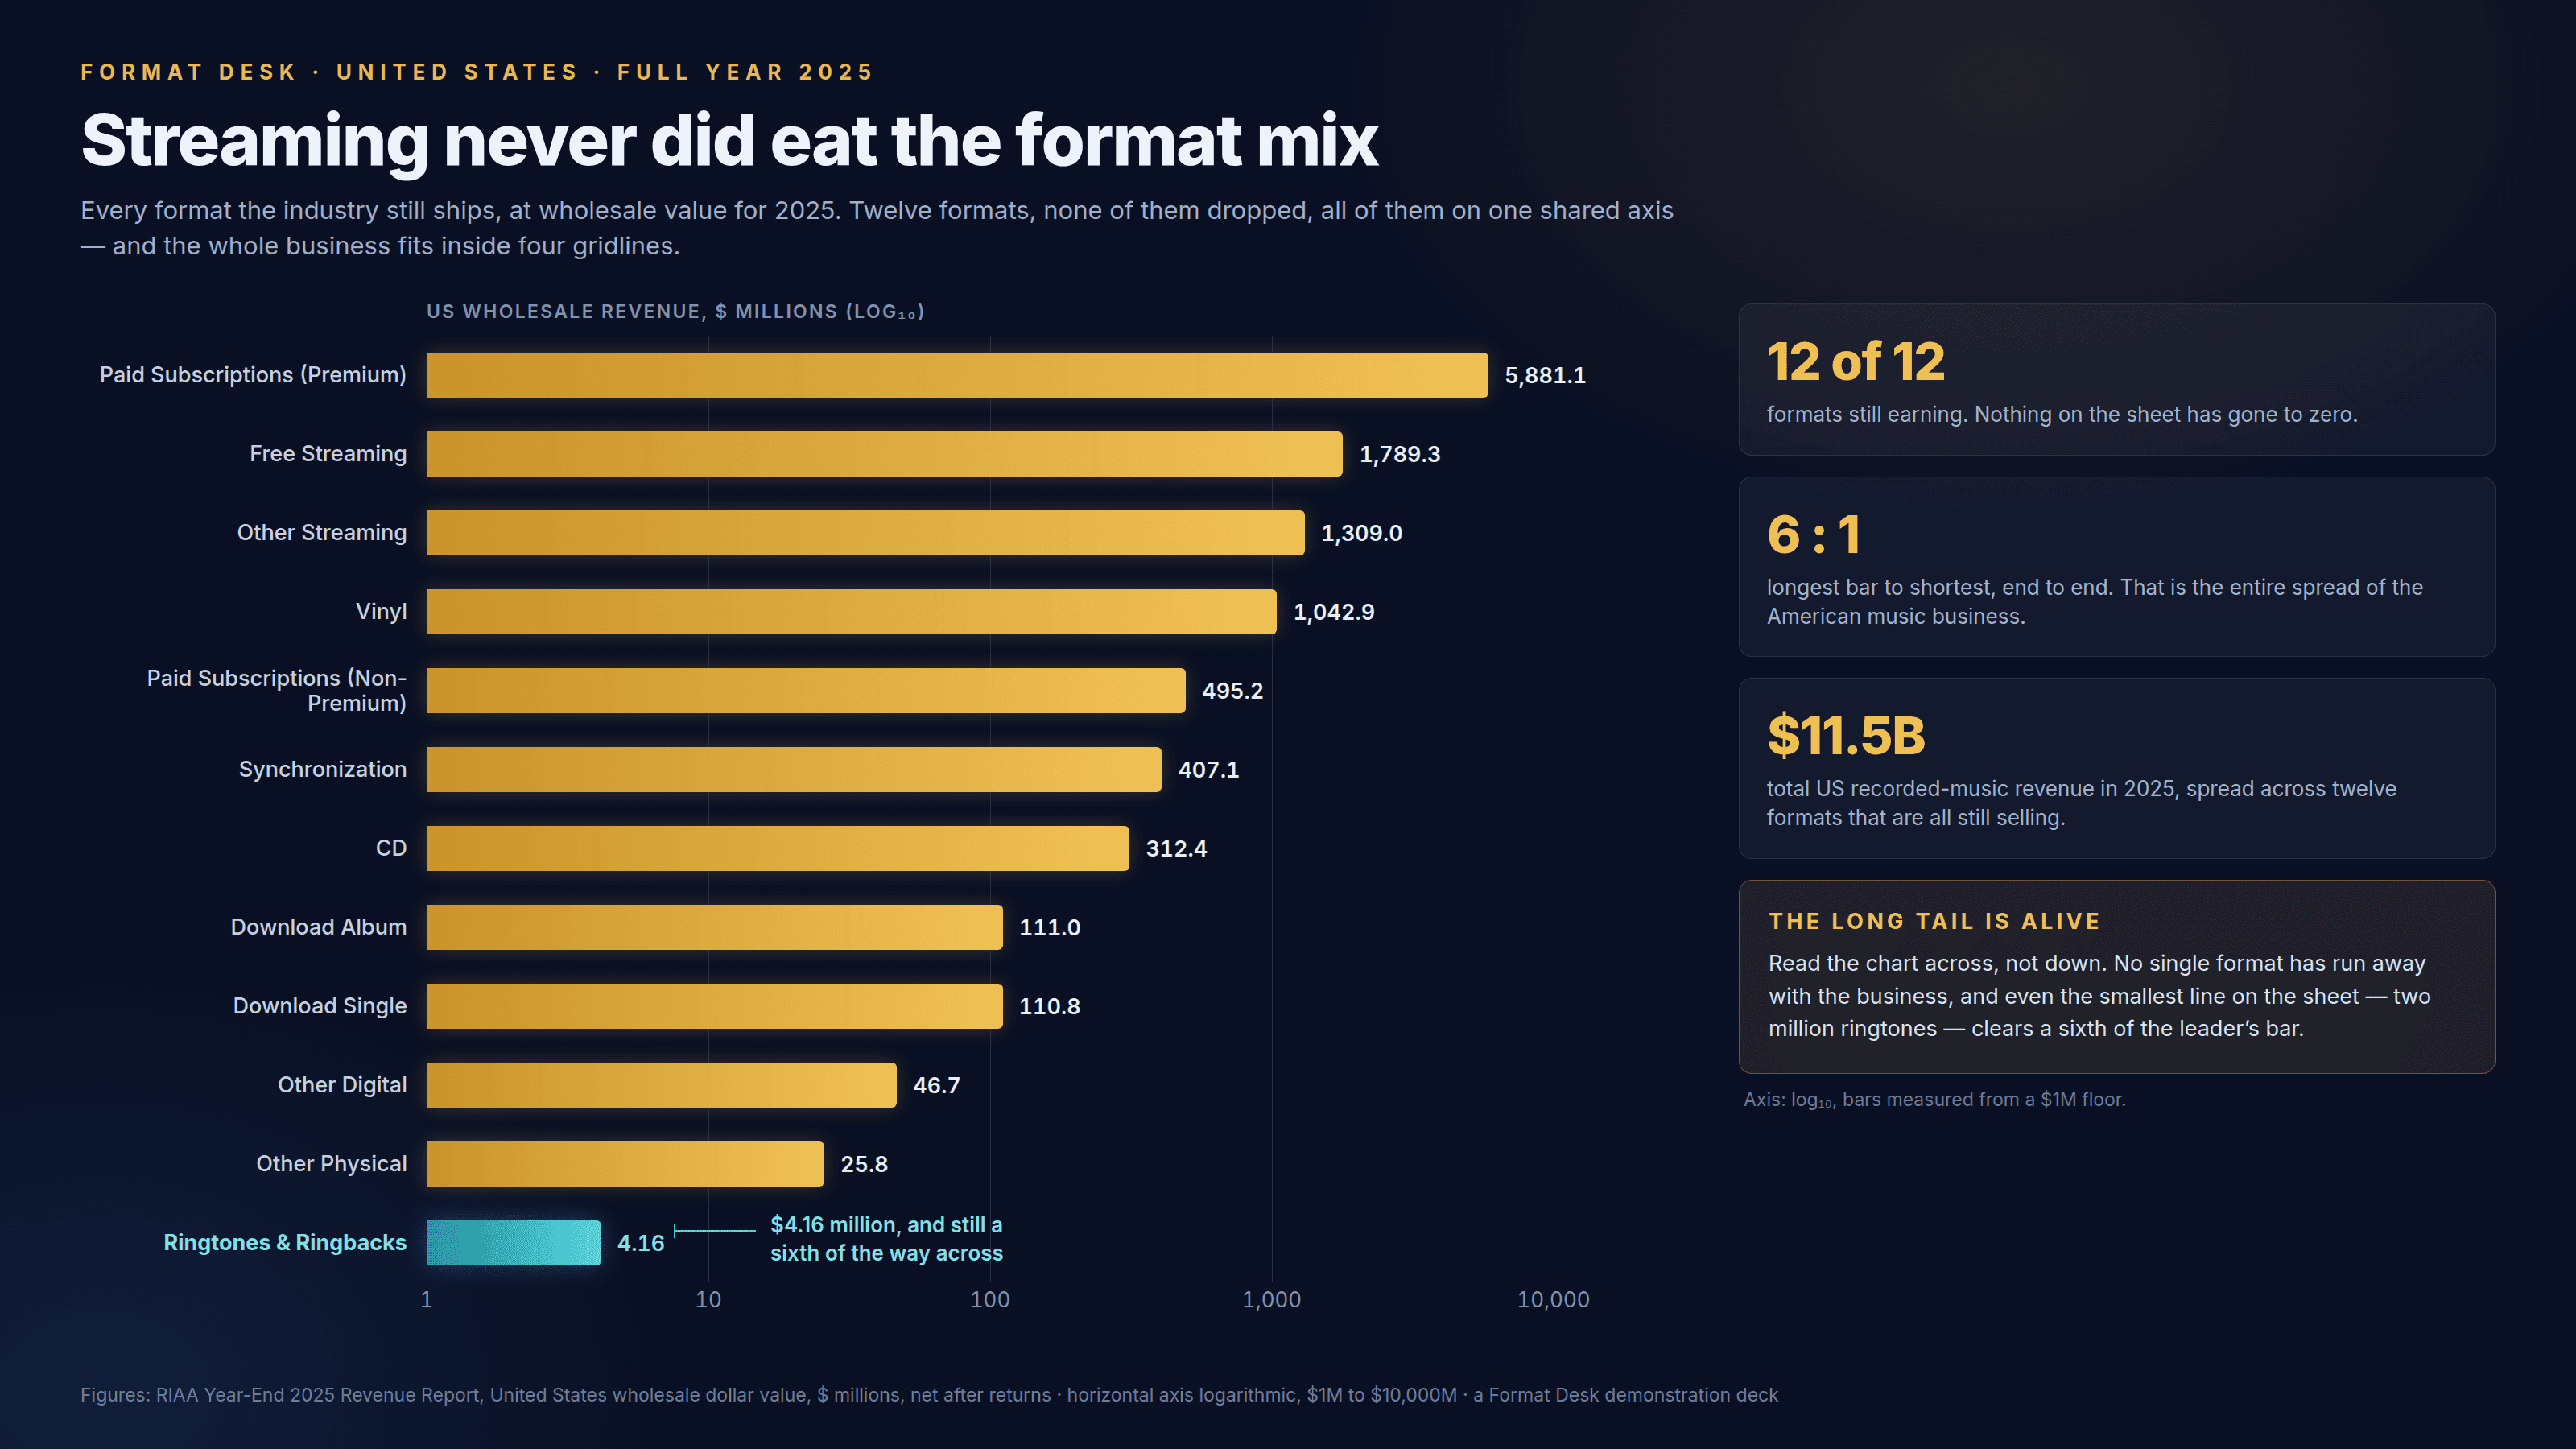
Every gridline is another ×10, and the eye reads them as equal steps.
a.k.a. logarithmic axis · orders of magnitude · ratio scale
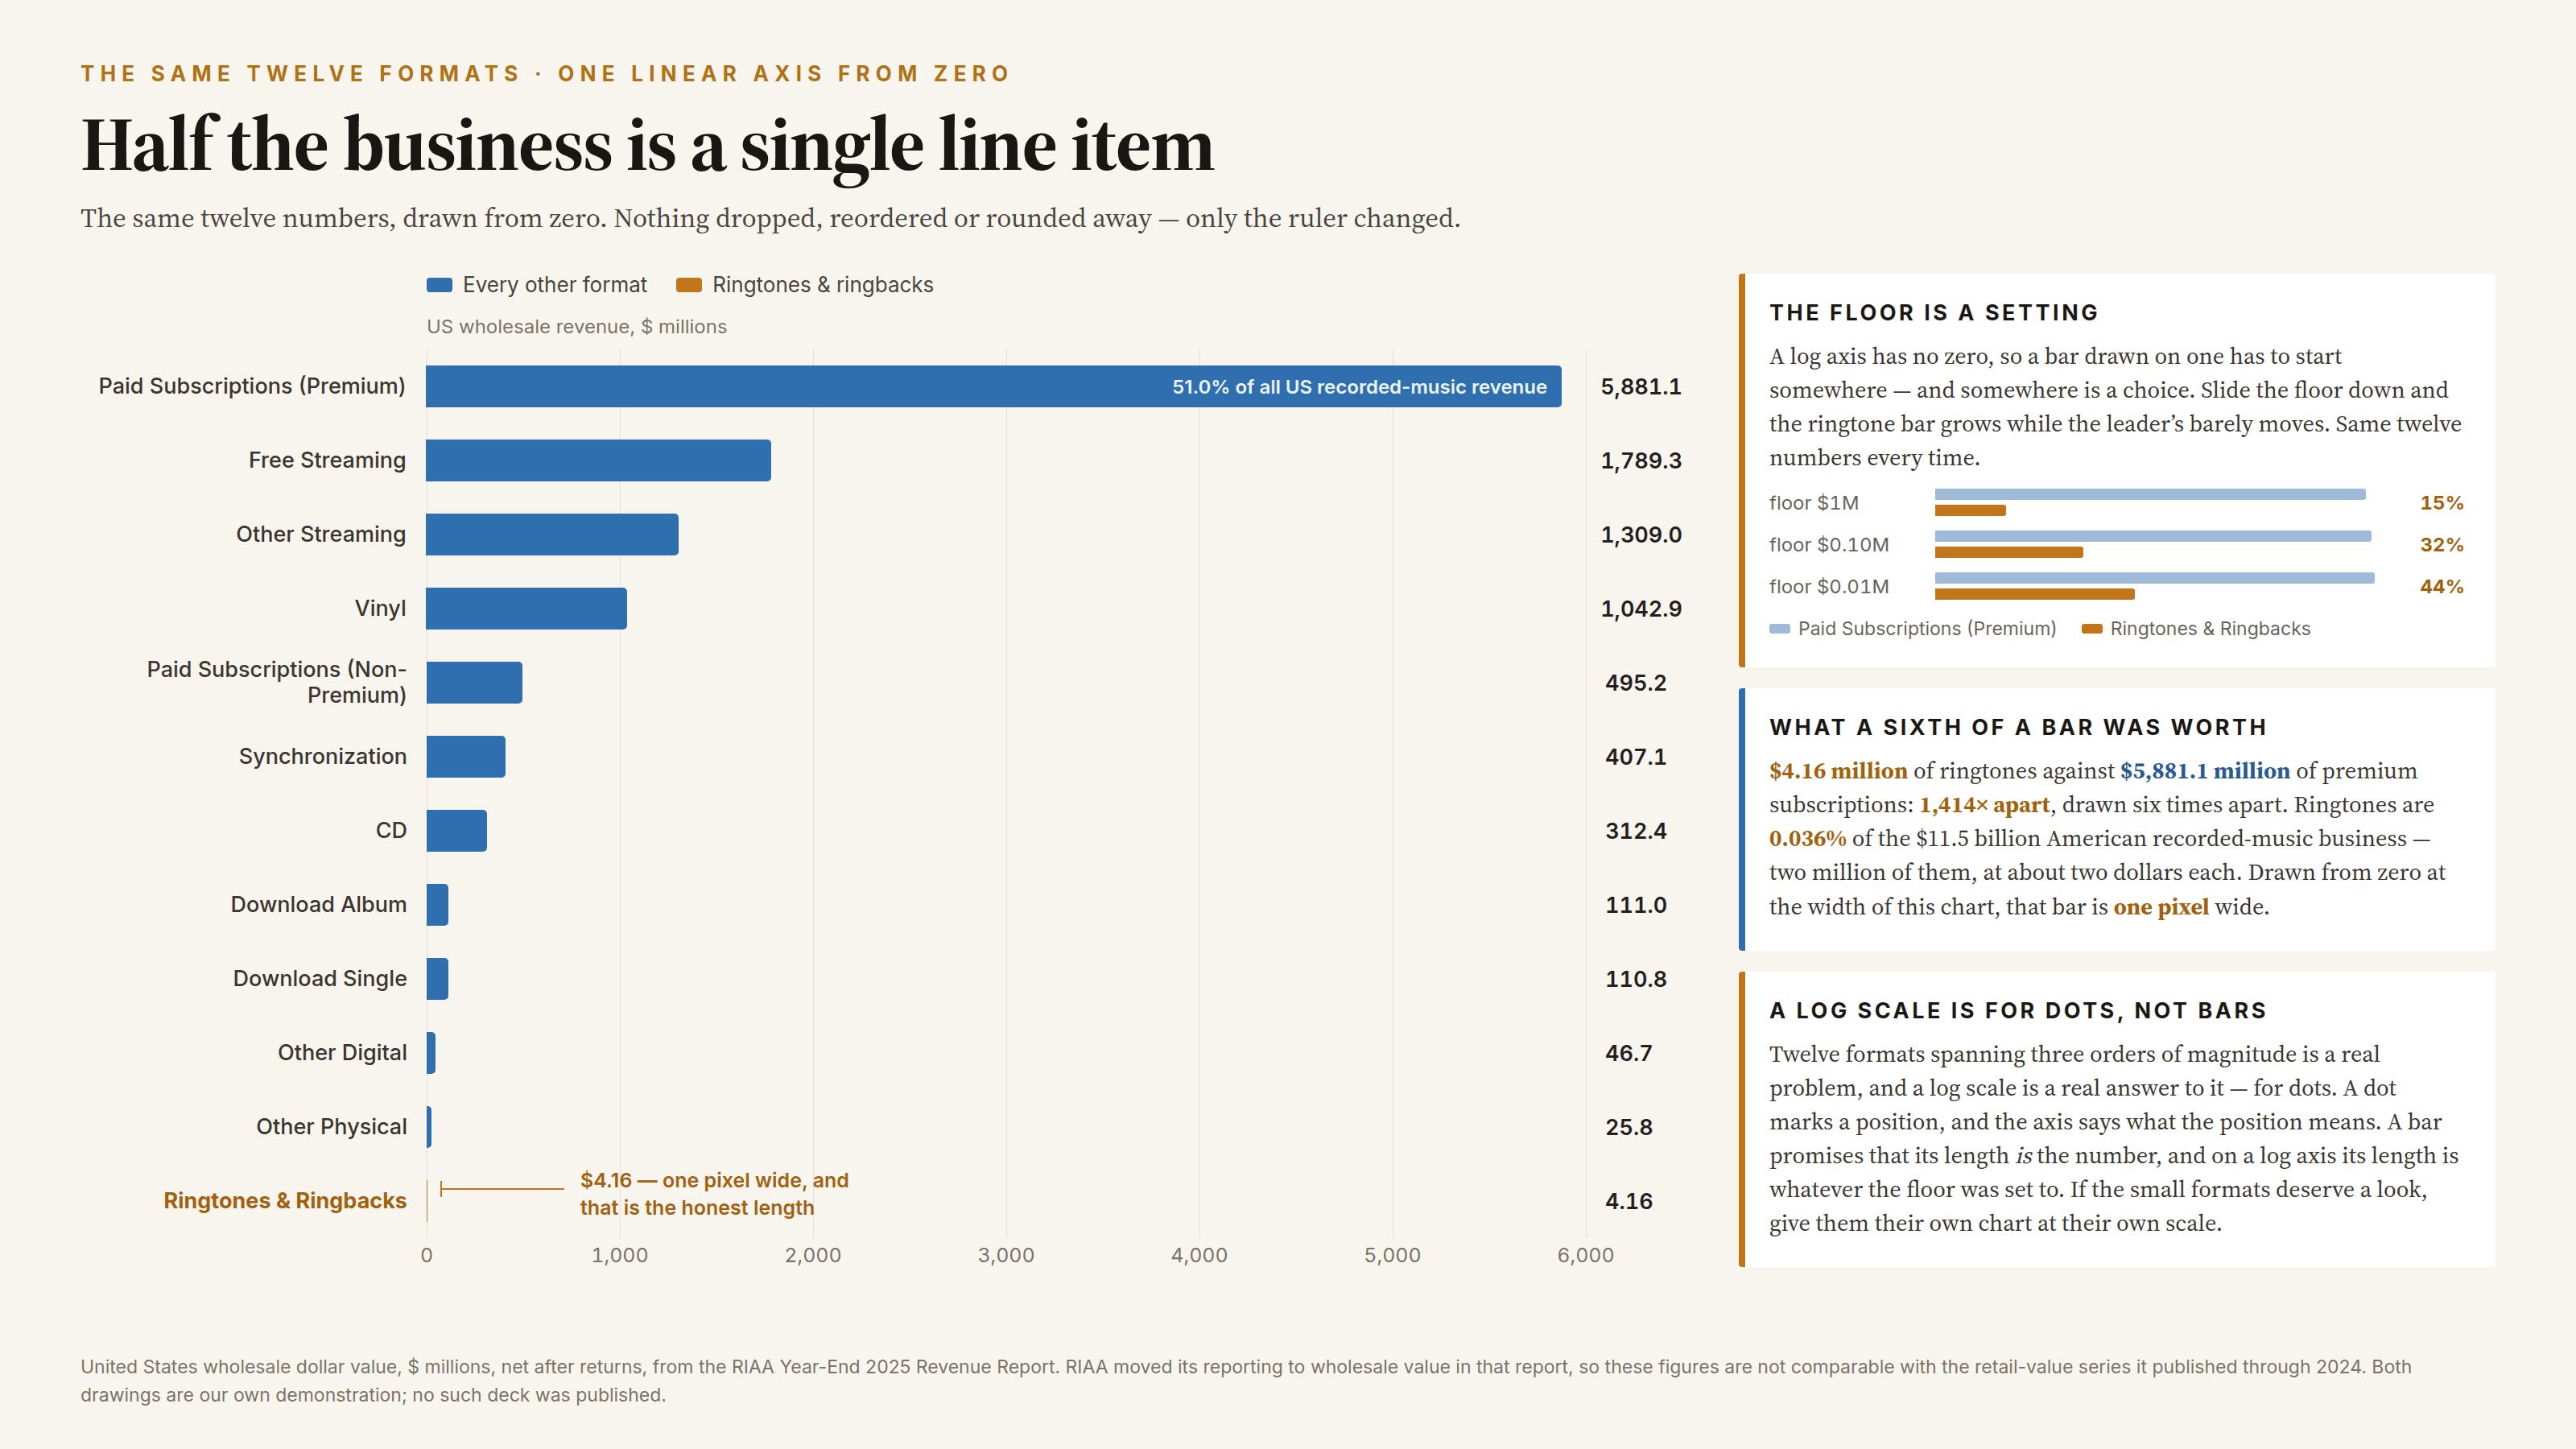
A log axis spaces equal ratios equally: 1 to 10 occupies the same width as 1,000 to 10,000. For data that genuinely spans orders of magnitude that is the right tool — but the eye still reads distance as amount, so a thousandfold gap arrives on the page looking like a modest lead. Put bars on one and it gets worse: a bar encodes its value as length from zero, and a log axis has no zero, so every bar’s length is set by wherever the axis was started.
How to spot it
- Read the axis numbers. 1, 10, 100, 1,000 is a log scale; 1, 2, 3 is not.
- Bars on a log axis — ask where the axis begins, then imagine it beginning a decade lower.
- Growth that appears to be “slowing” or “going linear”: on a log axis a straight line is a constant percentage, not a constant amount.
- Two values labelled a hundredfold apart whose marks look a hand’s width apart.
The fix
If the question is how much bigger, use a linear axis from zero. Keep the log scale for ranges that genuinely span orders of magnitude, label it loudly, and give it dots rather than bars — a dot marks a position, which is all a log axis can honestly encode. If the small values deserve attention, give them their own chart at their own scale.
In the gallery