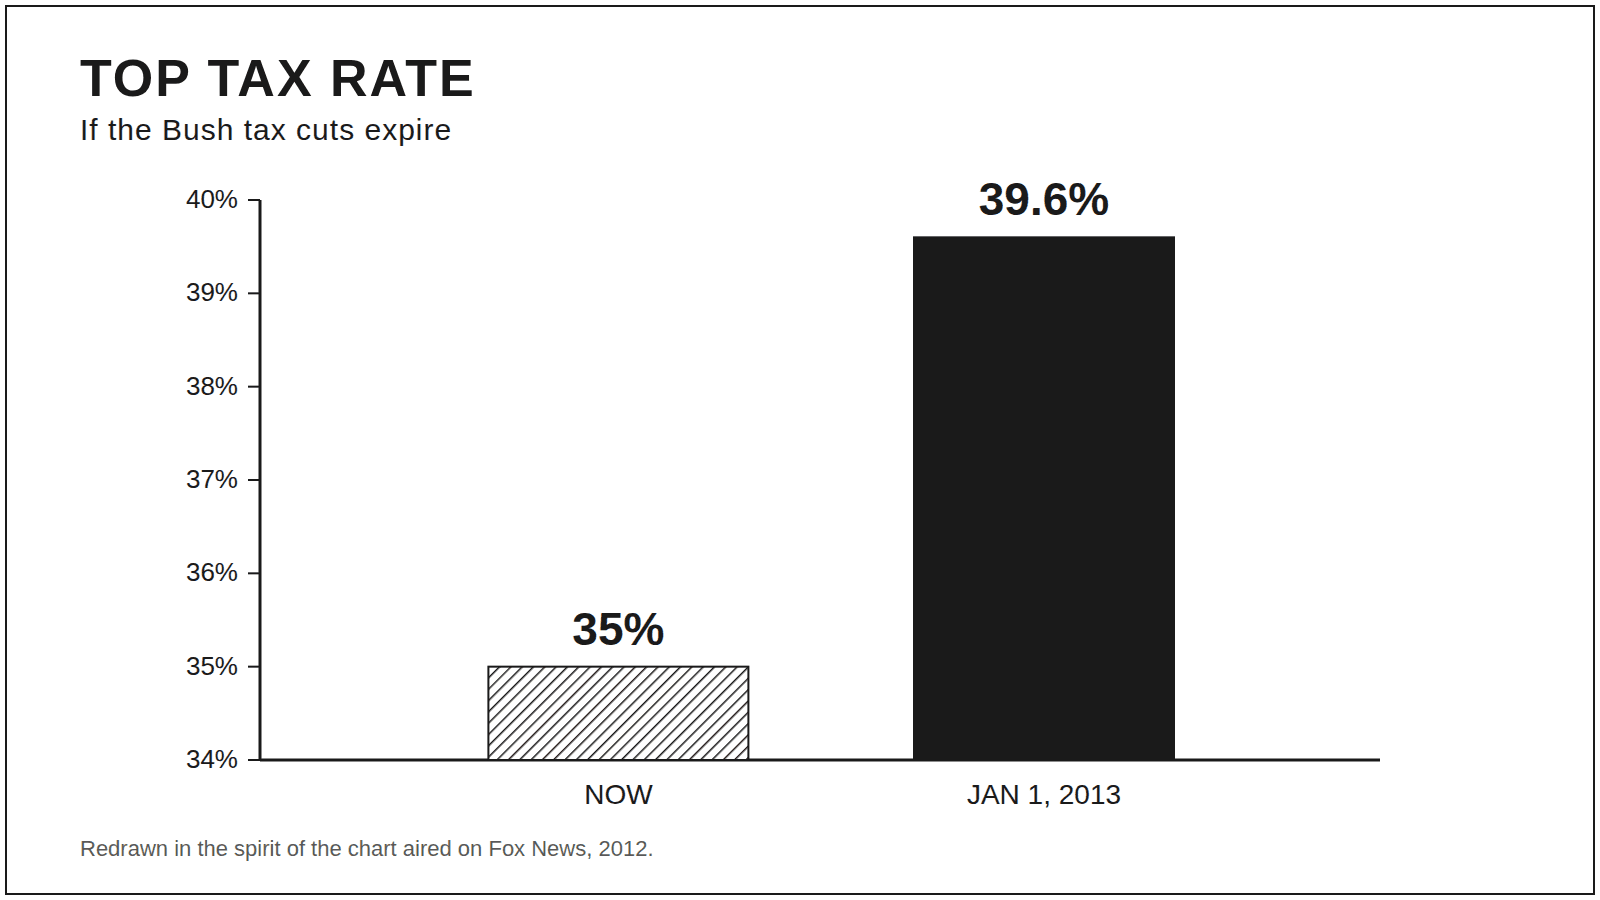
The 4.6-point tax hike that looked like a cliff
A top tax rate rising from 35% to 39.6%, drawn so the taller bar stands nearly six times the shorter one.
Fox News, 2012
Axis crimes
A 3% difference, presented as a landslide.
a.k.a. y-axis zoom · non-zero baseline
Bar charts encode value as length, so the baseline has to be zero — chop the bottom off the axis and a bar twice as tall no longer means twice as much. Start the axis at 94 and a one-point gap reads as total domination.
Bars start at zero, always. If the interesting action lives in a narrow range, switch to a line or dot plot and label the axis honestly.
A top tax rate rising from 35% to 39.6%, drawn so the taller bar stands nearly six times the shorter one.