All techniques
Cherry-picking
The reporting threshold
Every row on the chart cleared a line somebody drew. What didn’t clear it isn’t zero — it’s absent.
a.k.a. the de minimis cut · the coverage floor · the scope threshold · the eligibility rule · mandatory reporting limits · the registry cut-off · ships above 5,000 GT · facilities above 25,000 tonnes · firms with 250 or more employees · the regulatory dataset
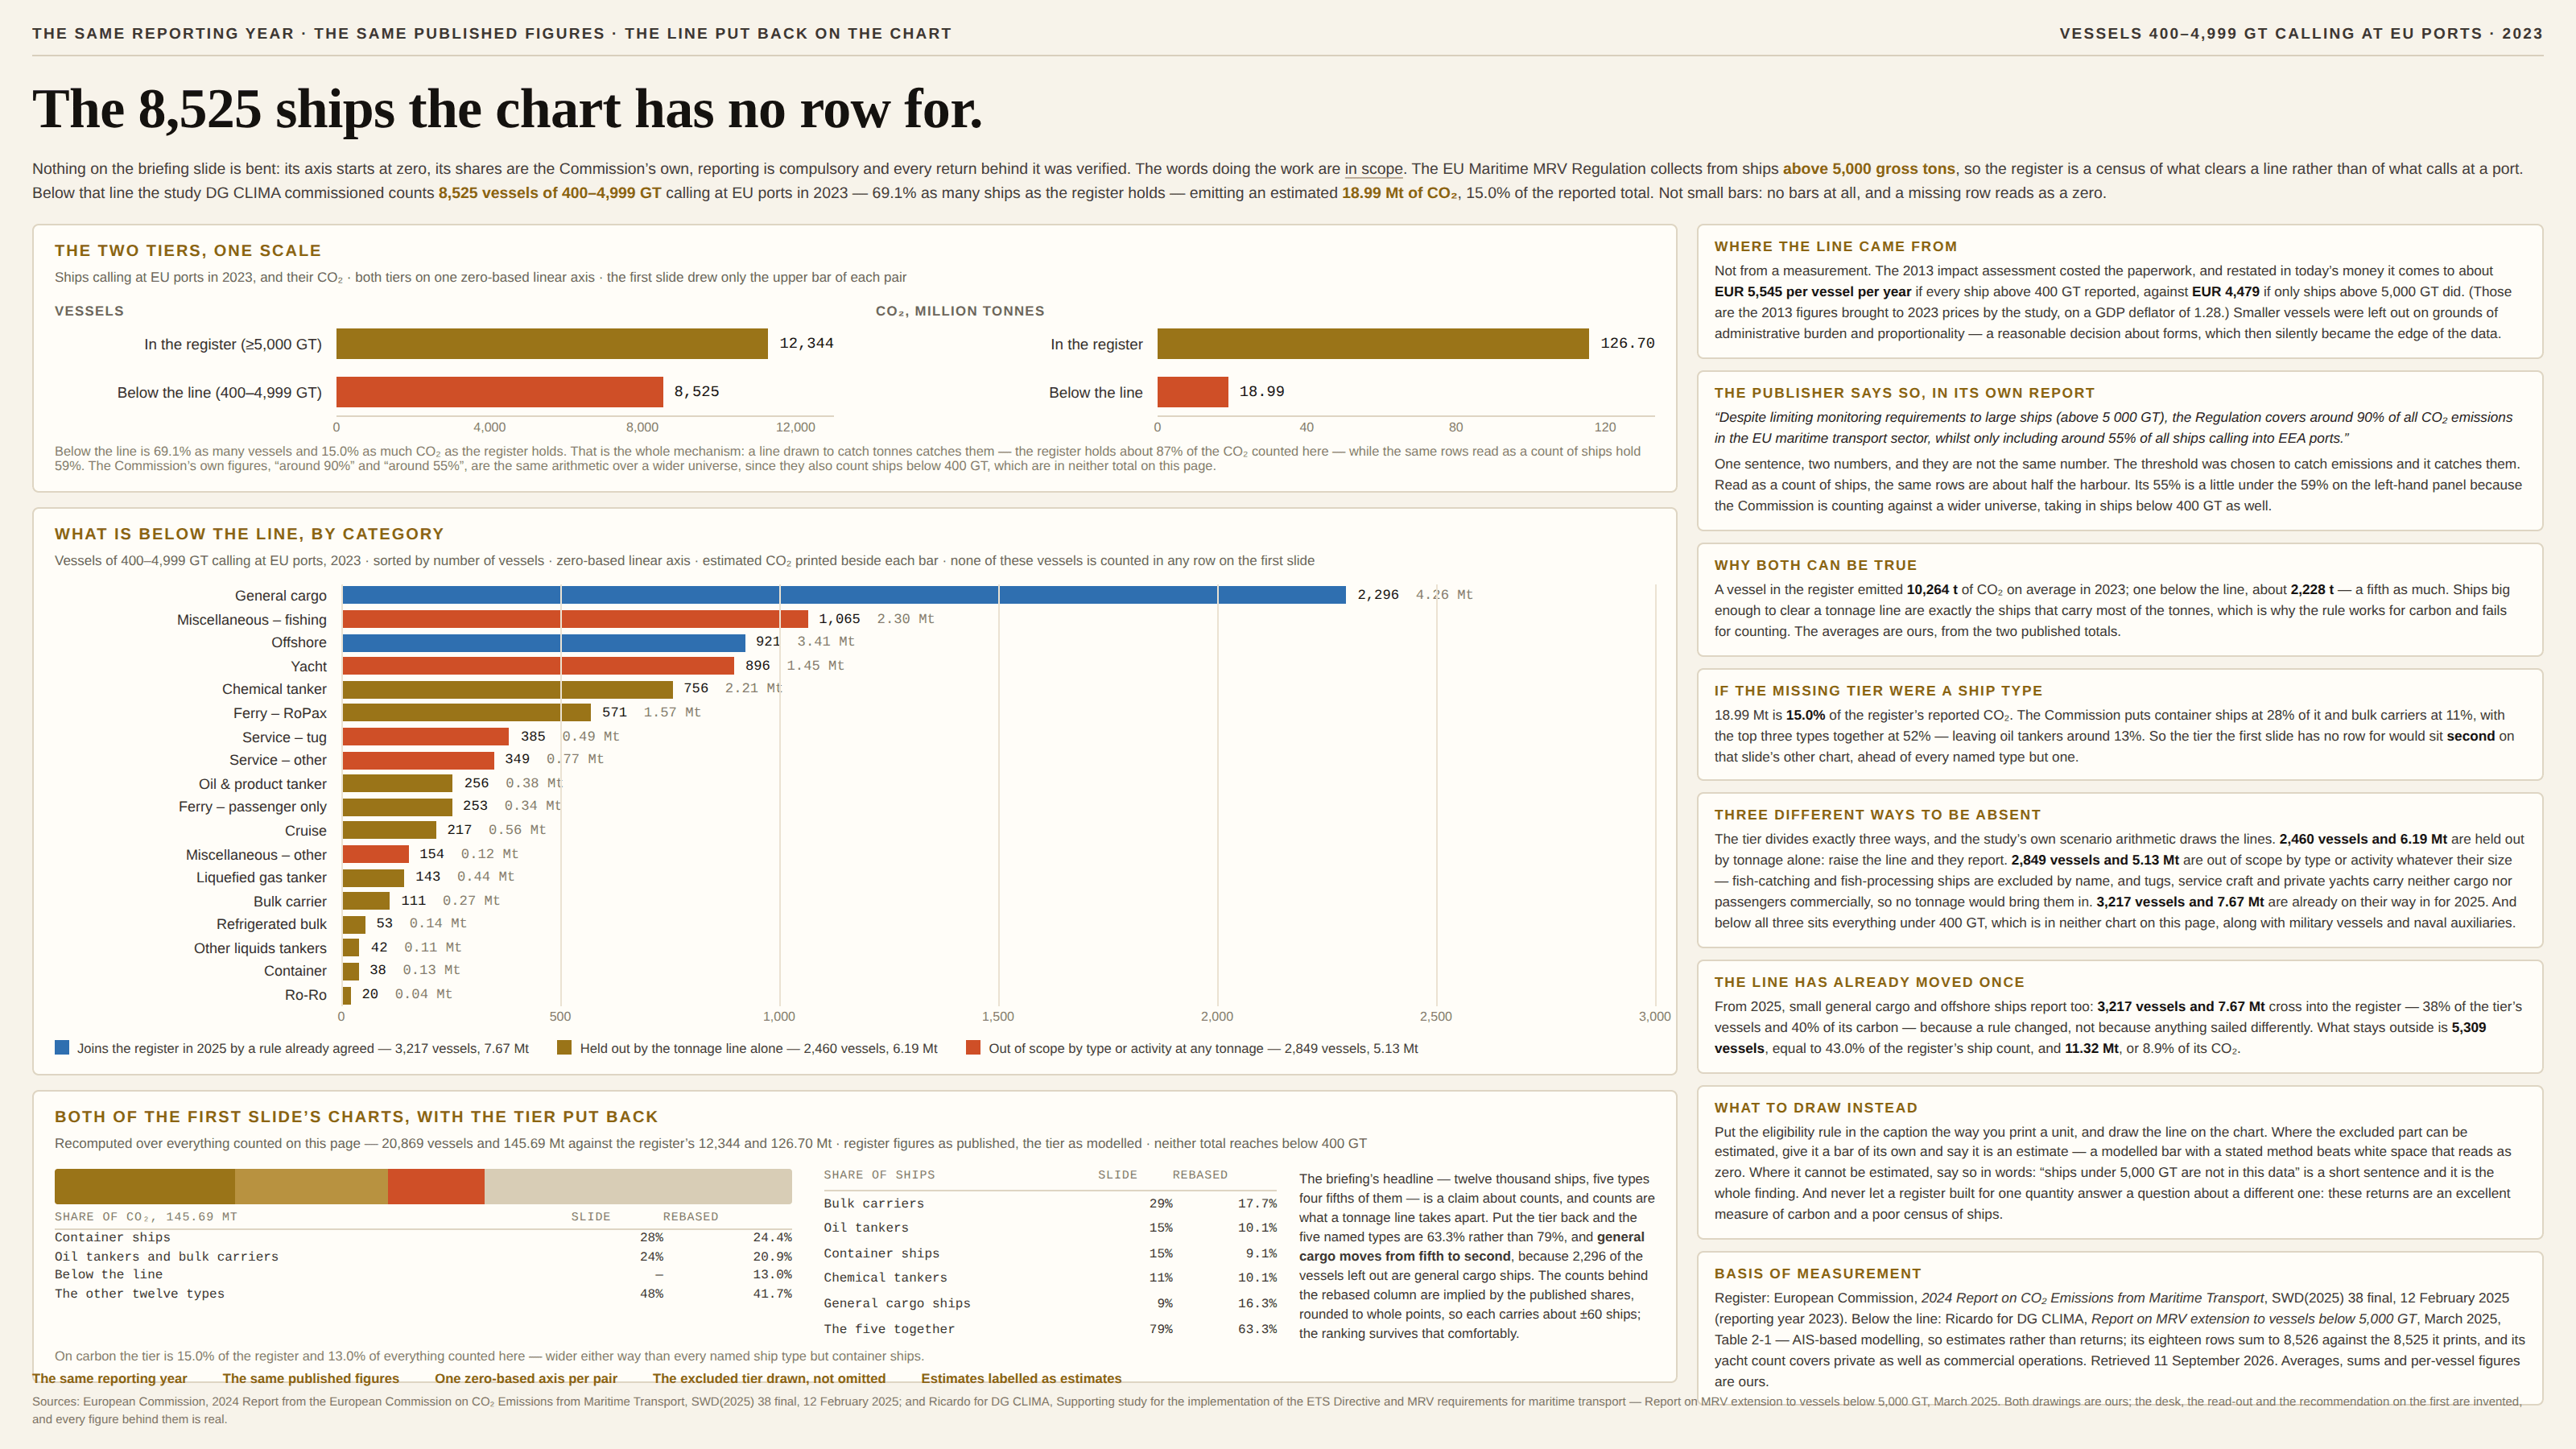
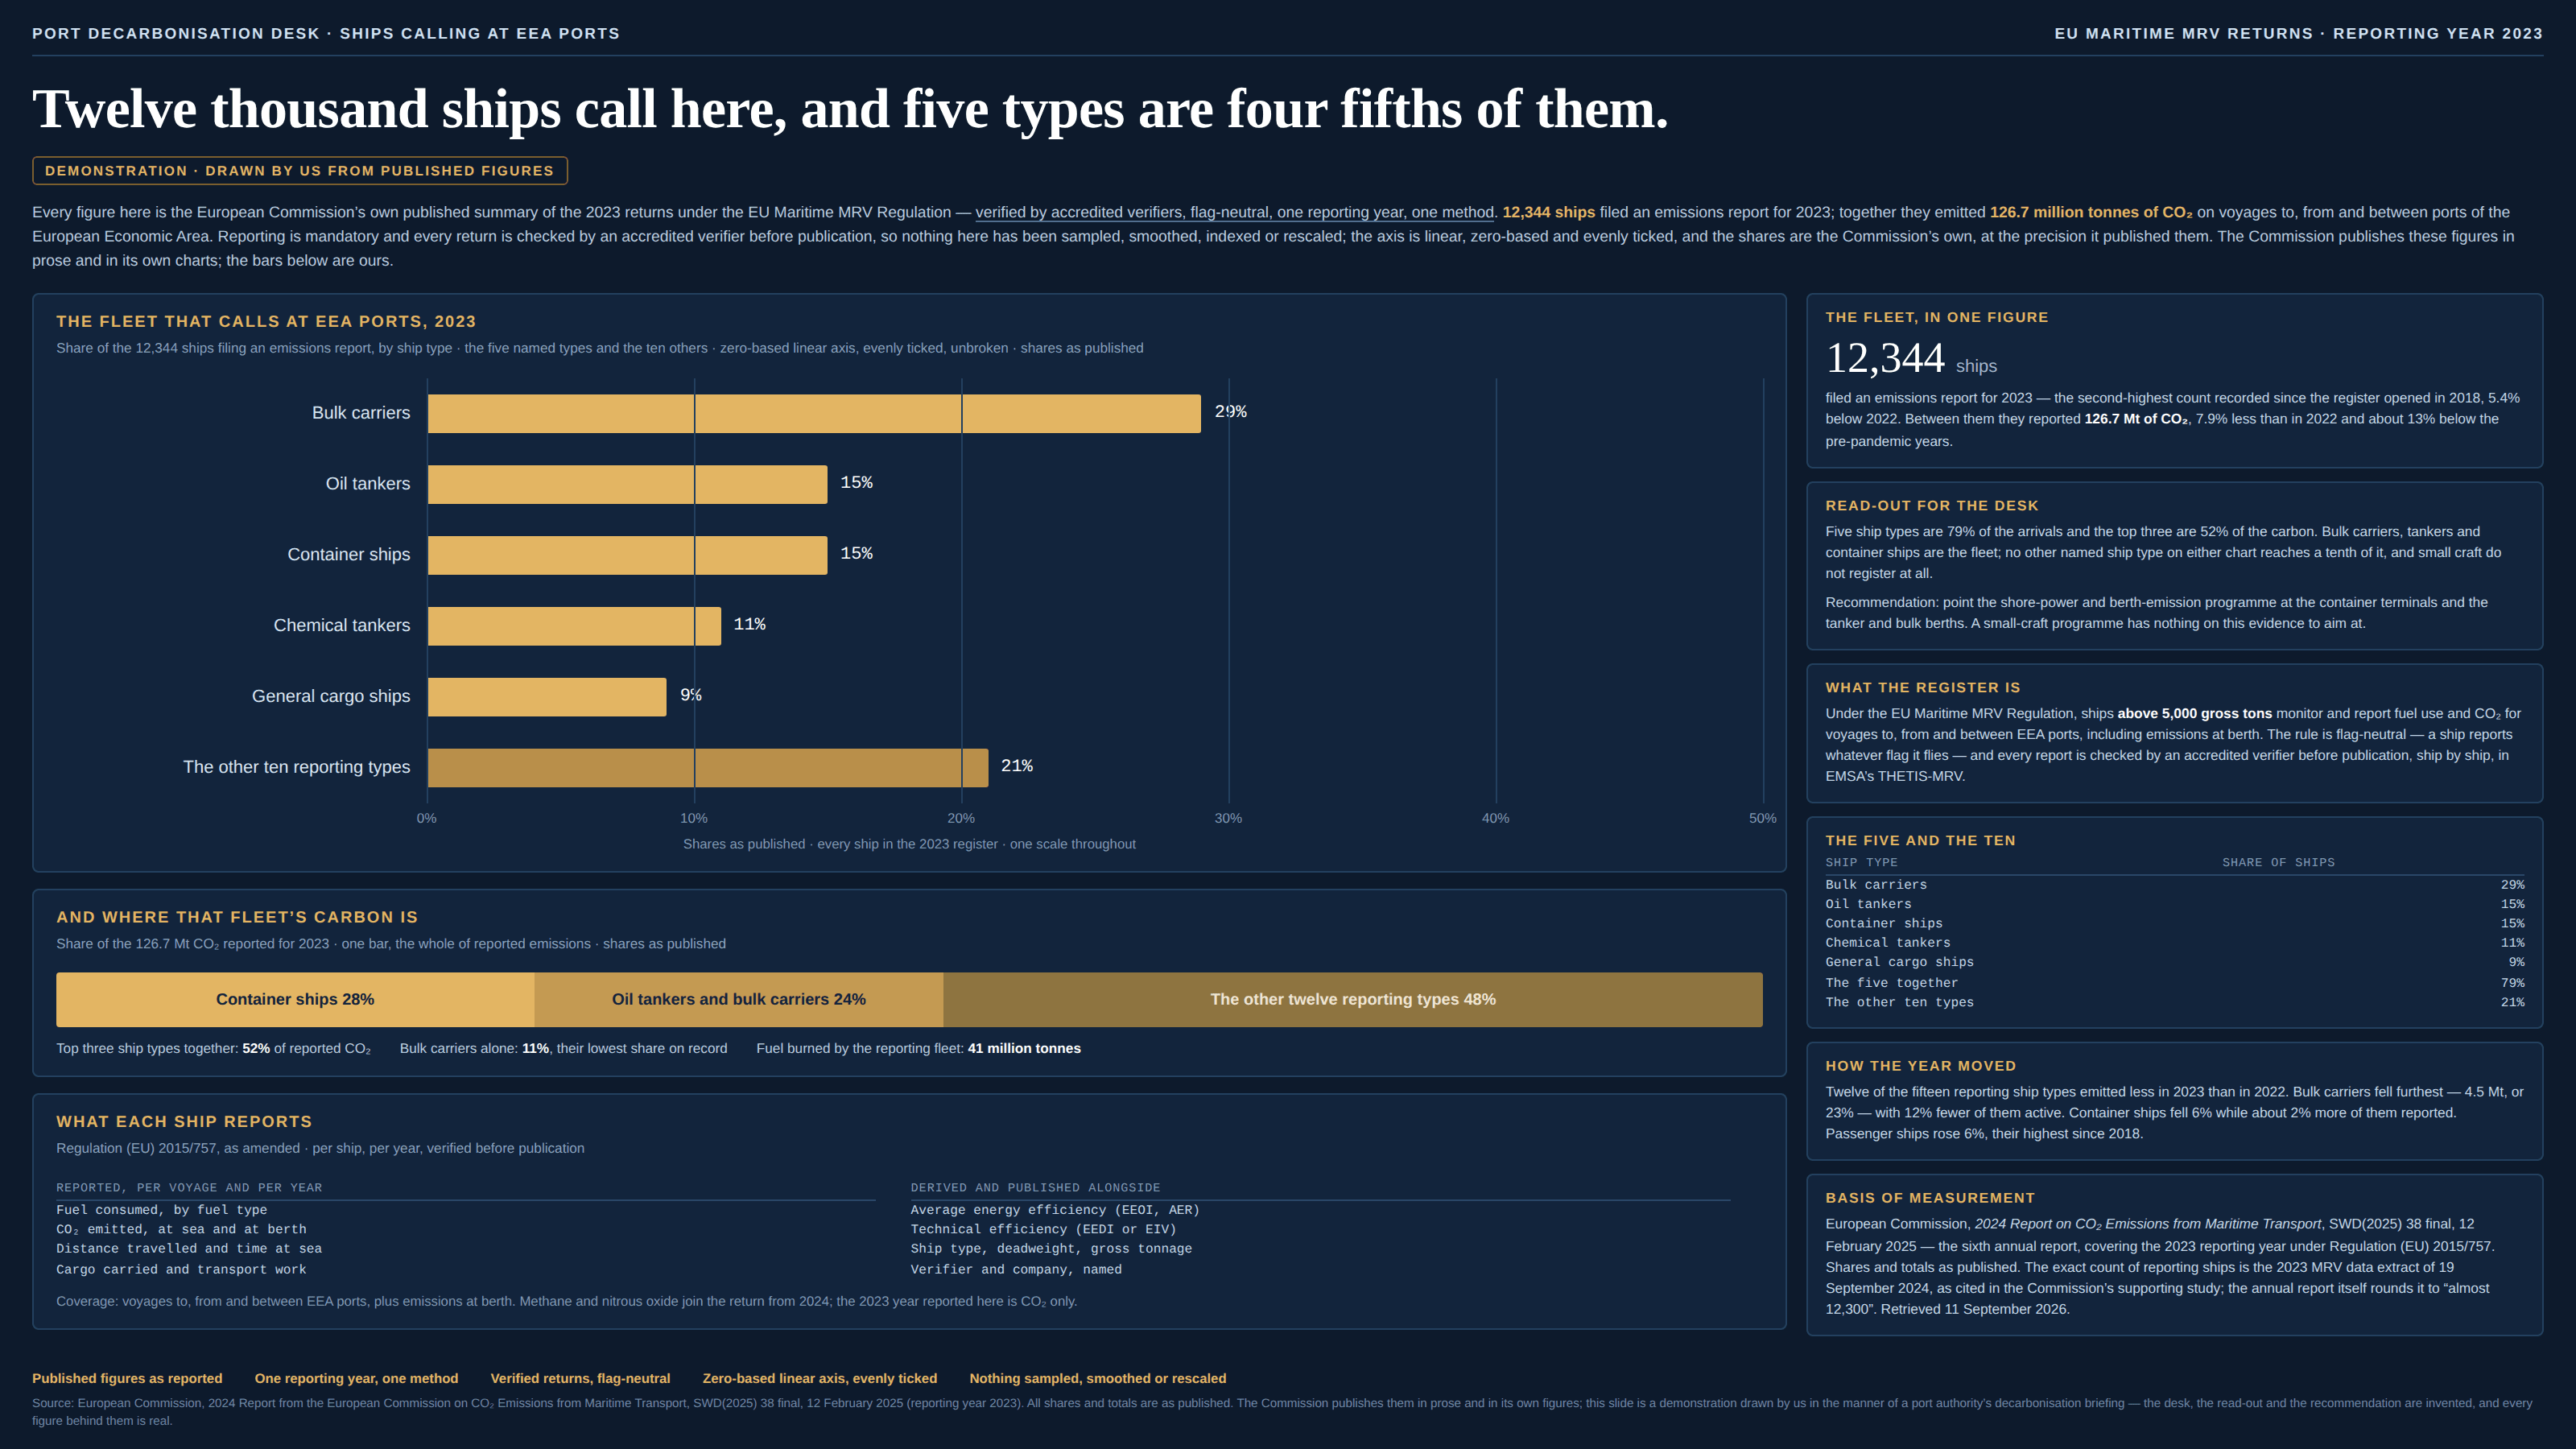
Most of the best data in the world exists because somebody was obliged to file it, and an obligation has to say who it applies to. So every register carries a line: above this tonnage, this headcount, this turnover, this emissions rate, you report — below it, you do not exist. The line is almost never a judgement about the data. It is a judgement about paperwork, made once, in an impact assessment, by weighing what a return costs the filer against what the regulator gains. Then the register is published, and it is superb: mandatory, audited, comprehensive, unbiased in every respect the word normally means. The trouble starts when it is read as a picture of the world rather than a picture of the filers. Because the threshold is a size rule, what it removes is not a random sample — it is everything small, which is usually most of the units and a minority of the quantity. A line set to capture 90% of the tonnes can easily hold half the objects, and both of those sentences are true of the same rows. Absence then does the rest, because a category with no row does not look like missing data: it looks like a zero, or like nothing worth a row. And thresholds move — a rule is amended, a limit is not indexed and inflation drags units over it — so the same series can step up or down in a year when nothing in the world changed but the eligibility clause.
How to spot it
- Ask who was obliged to file this, and what the obligation said. Every mandatory dataset has a scope clause, and it is normally one sentence: above 5,000 gross tons, over 25,000 tonnes of CO₂e a year, 250 employees or more, facilities of this capacity and no smaller.
- Read the denominator. “42% of the industry” computed inside a register means 42% of the filers, and the filers are the ones above the line.
- Look for the category that is missing entirely rather than small. Small things arrive as short bars; excluded things arrive as no bar, and no bar is the one value the eye reads as agreement.
- Check whether the threshold and the question are about the same quantity. A line drawn to catch emissions catches emissions; asked how many ships, how many farms, how many firms, the same rows answer a question they were not built for.
- Watch the publisher’s own caveat. Regulators are usually candid about coverage — “covers around 90% of emissions, around 55% of ships” — and that sentence, in the front matter, is frequently the only place the chart’s limits appear.
- A step in a time series with no event behind it. Ask when the scope last changed: units brought in, a limit raised, an exemption expiring. The picture moves because the rule moved.
- Watch for bunching just above the line and a cliff just below it. Where reporting is costly, some units stay small on purpose, which makes the smallest reported size class its own artefact.
- Ask whether anything below the line has been estimated elsewhere. Where a second source models the excluded tier — an AIS study, a survey, a satellite inventory — the gap between the two is the size of what the register cannot see.
The fix
Say what the rule is, in the caption, the way you print a unit: this chart shows ships above 5,000 gross tons, facilities above 25,000 tonnes, firms with ten or more employees. Then draw the line on the chart. Where the excluded tier has been estimated by anyone — and for most big registers somebody has, because the regulator needed to know before it set the line — give the estimate a bar of its own, in its own shade, labelled as an estimate: a modelled bar with a stated method beats white space, because white space is read as zero and a labelled estimate is read as an estimate. Where nothing has been estimated, write the sentence anyway, since “units under this size are not in this data” is short and it is the whole finding. Match the register to the question rather than the other way round: a threshold chosen to capture a quantity is excellent evidence about that quantity and poor evidence about how many things there are, so a census question needs a census, or at least a line saying which one you had. Keep the threshold in view when the series moves, too — annotate the year the scope changed and, where the numbers allow, draw the old scope and the new one as two series rather than one with a step in it. And never let a share computed inside a register be quoted as a share of the world: the denominator has the rule baked into it, and so does every percentage taken off it.
In the gallery