All techniques
Cherry-picking
Regression to the mean
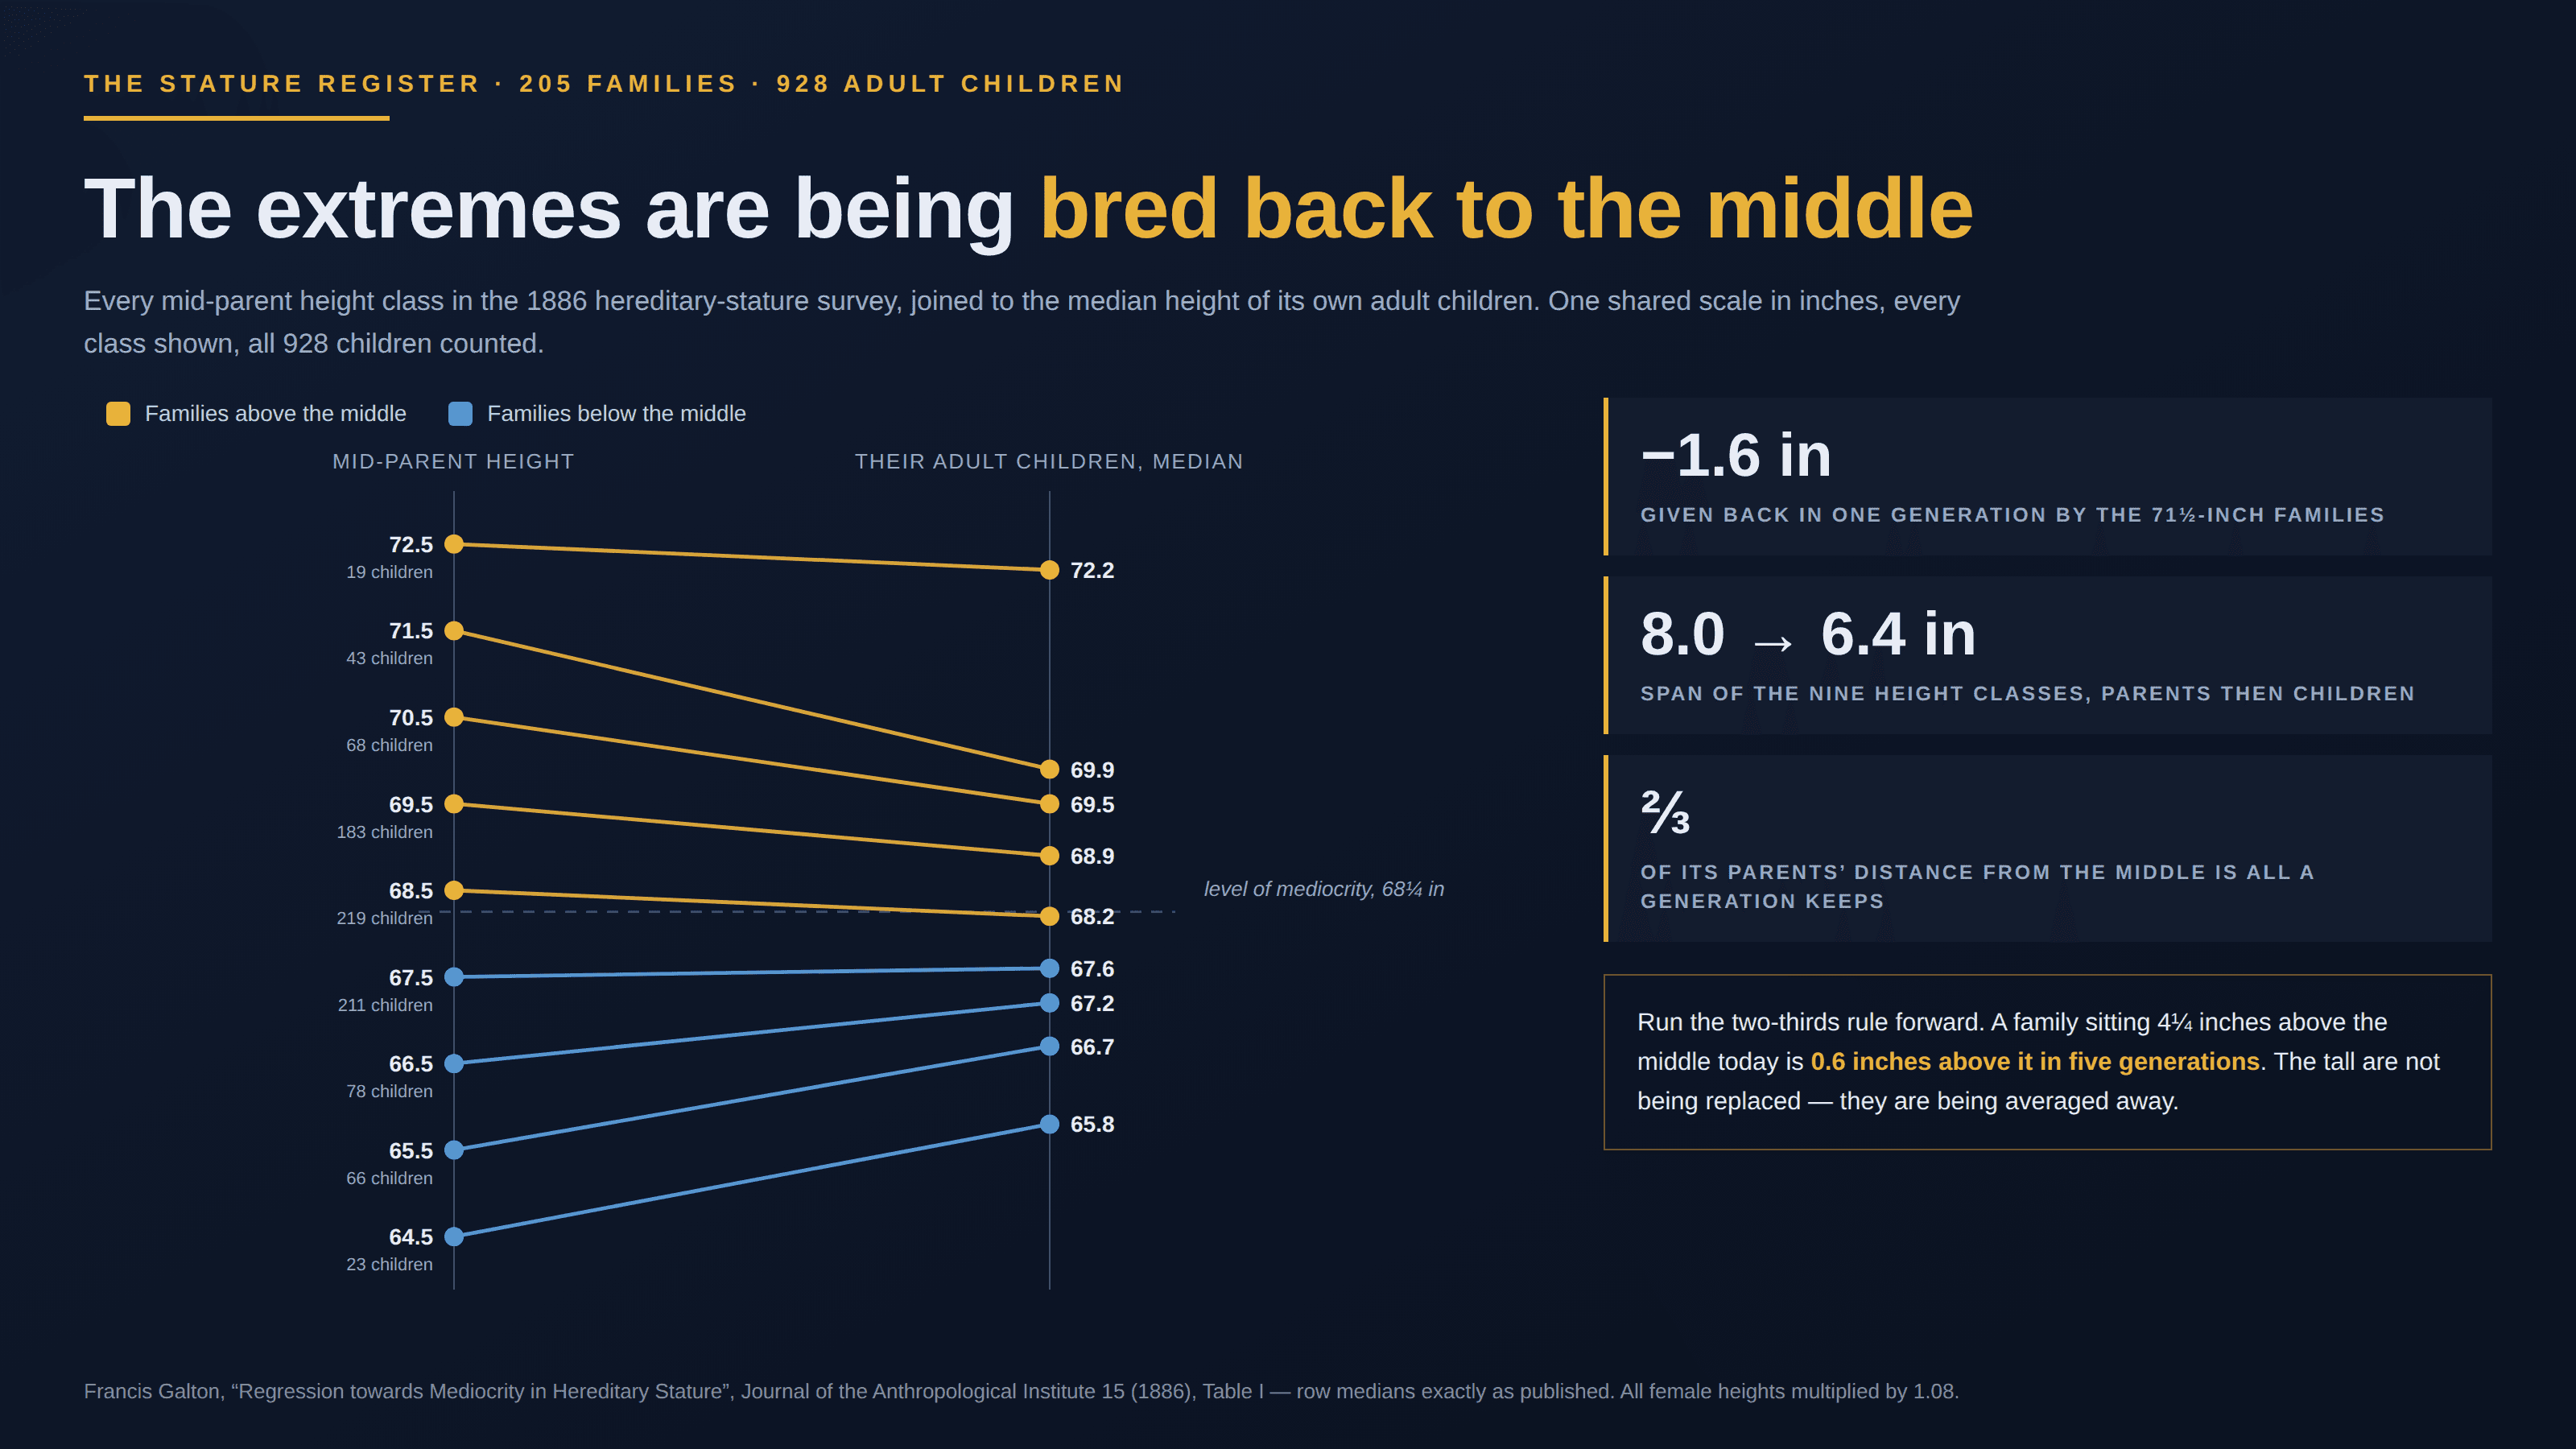
Pick the extremes and they improve without your help.
a.k.a. the regression fallacy · selecting on an extreme · the sophomore slump
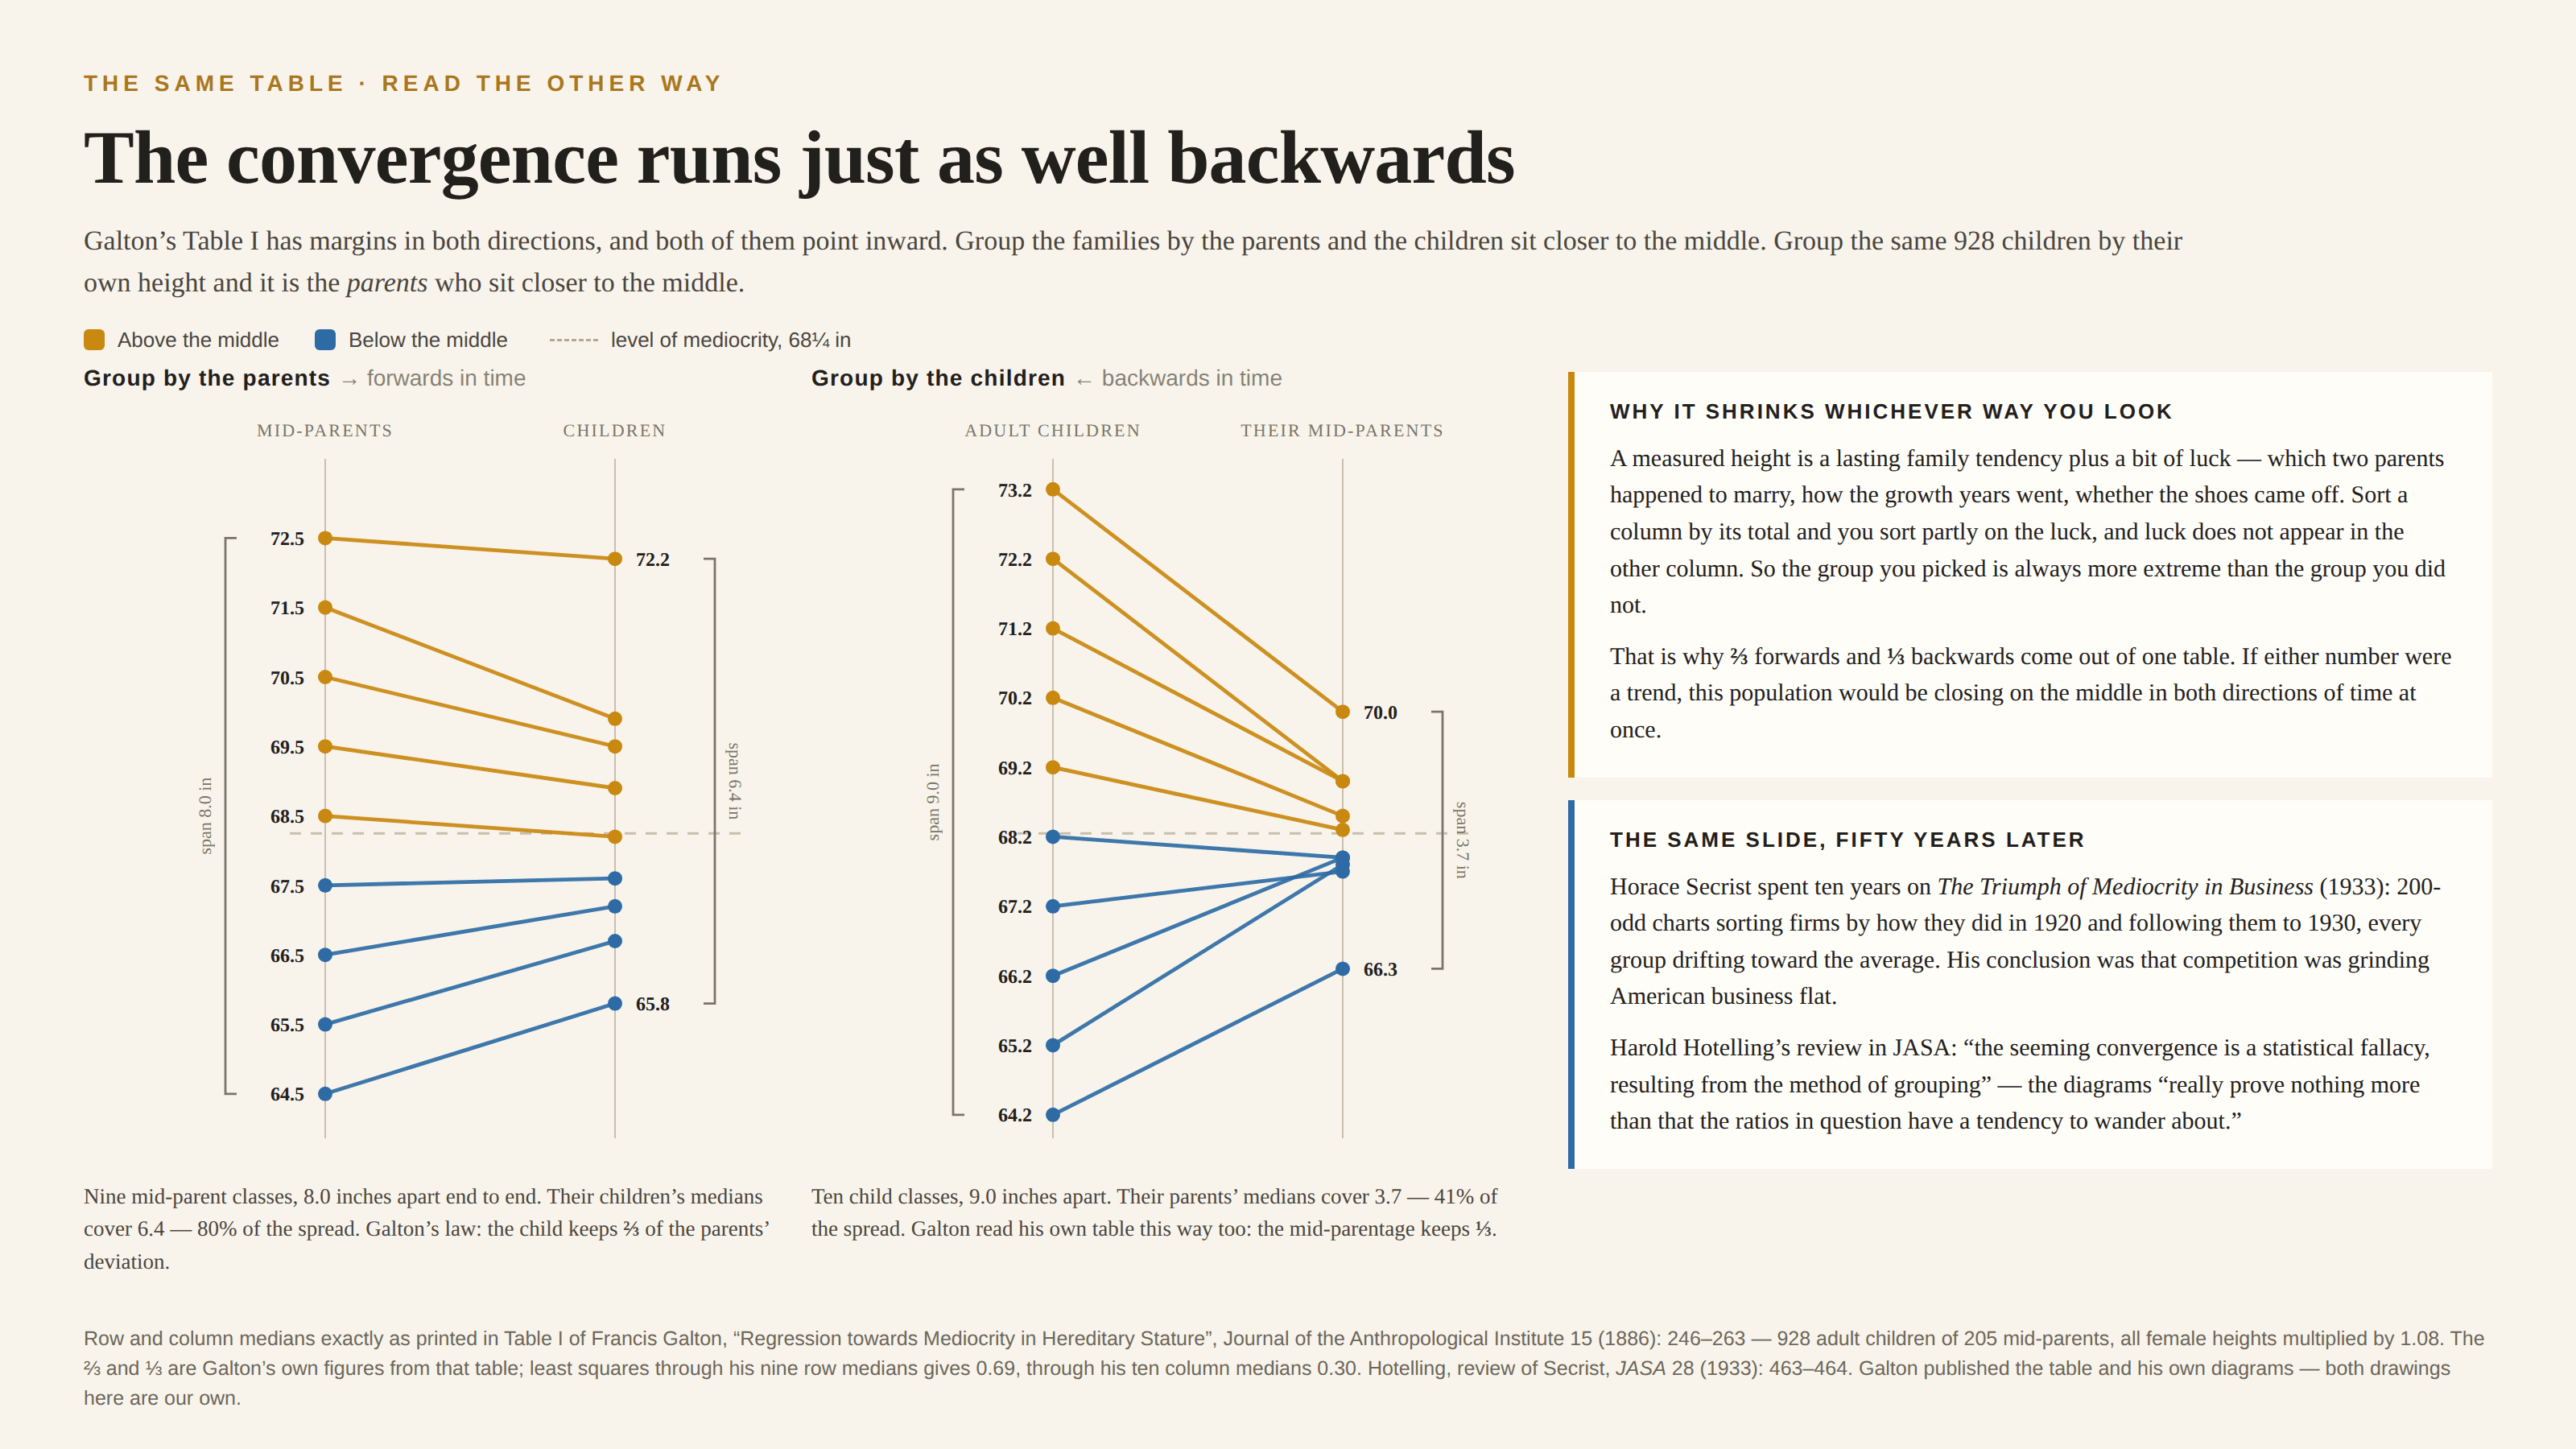
Almost any measurement is a lasting tendency plus a bit of luck. Sort a group by that measurement and you sort partly on the luck — so the group you picked is more extreme than it really is, and its next reading drifts back toward the average all by itself. Chart the drift and it looks like a treatment working, a trend arriving, or a curse falling.
How to spot it
- The group was chosen for being top or bottom of a first measurement.
- “Most improved” and “biggest fallers” lists whose names never repeat.
- An effect with no control group picked the same way as the treated one.
- Run the grouping backwards: sort on the second measurement and look at the first. If it converges in that direction too, nothing is moving.
The fix
Choose the group on something other than the number you are about to compare it against — an earlier period, a random draw, a control selected identically. Show the whole distribution rather than the fate of the tails, and expect a slice picked at its extreme to move toward the middle whether or not anything happened to it.
In the gallery