All techniques
Framing & context
The redefined measure
The step in the line is the year the definition changed.
a.k.a. series break · definitional change · recoded series · discontinuity · the ruler changed
Long series outlive the rules that made them. A classification is revised, a diagnostic threshold moves, a question is reworded, an instrument gets more sensitive — and the number jumps on the day the change took effect, with nothing in the world having moved. The chart plots both régimes as one line, so the step reads as an event. It is usually disclosed and almost never on the chart.
How to spot it
- A step that lands exactly on a boundary — a new year, a new form, a new system.
- Find out what changed that year. The methodology note is where the change lives; the chart rarely repeats it.
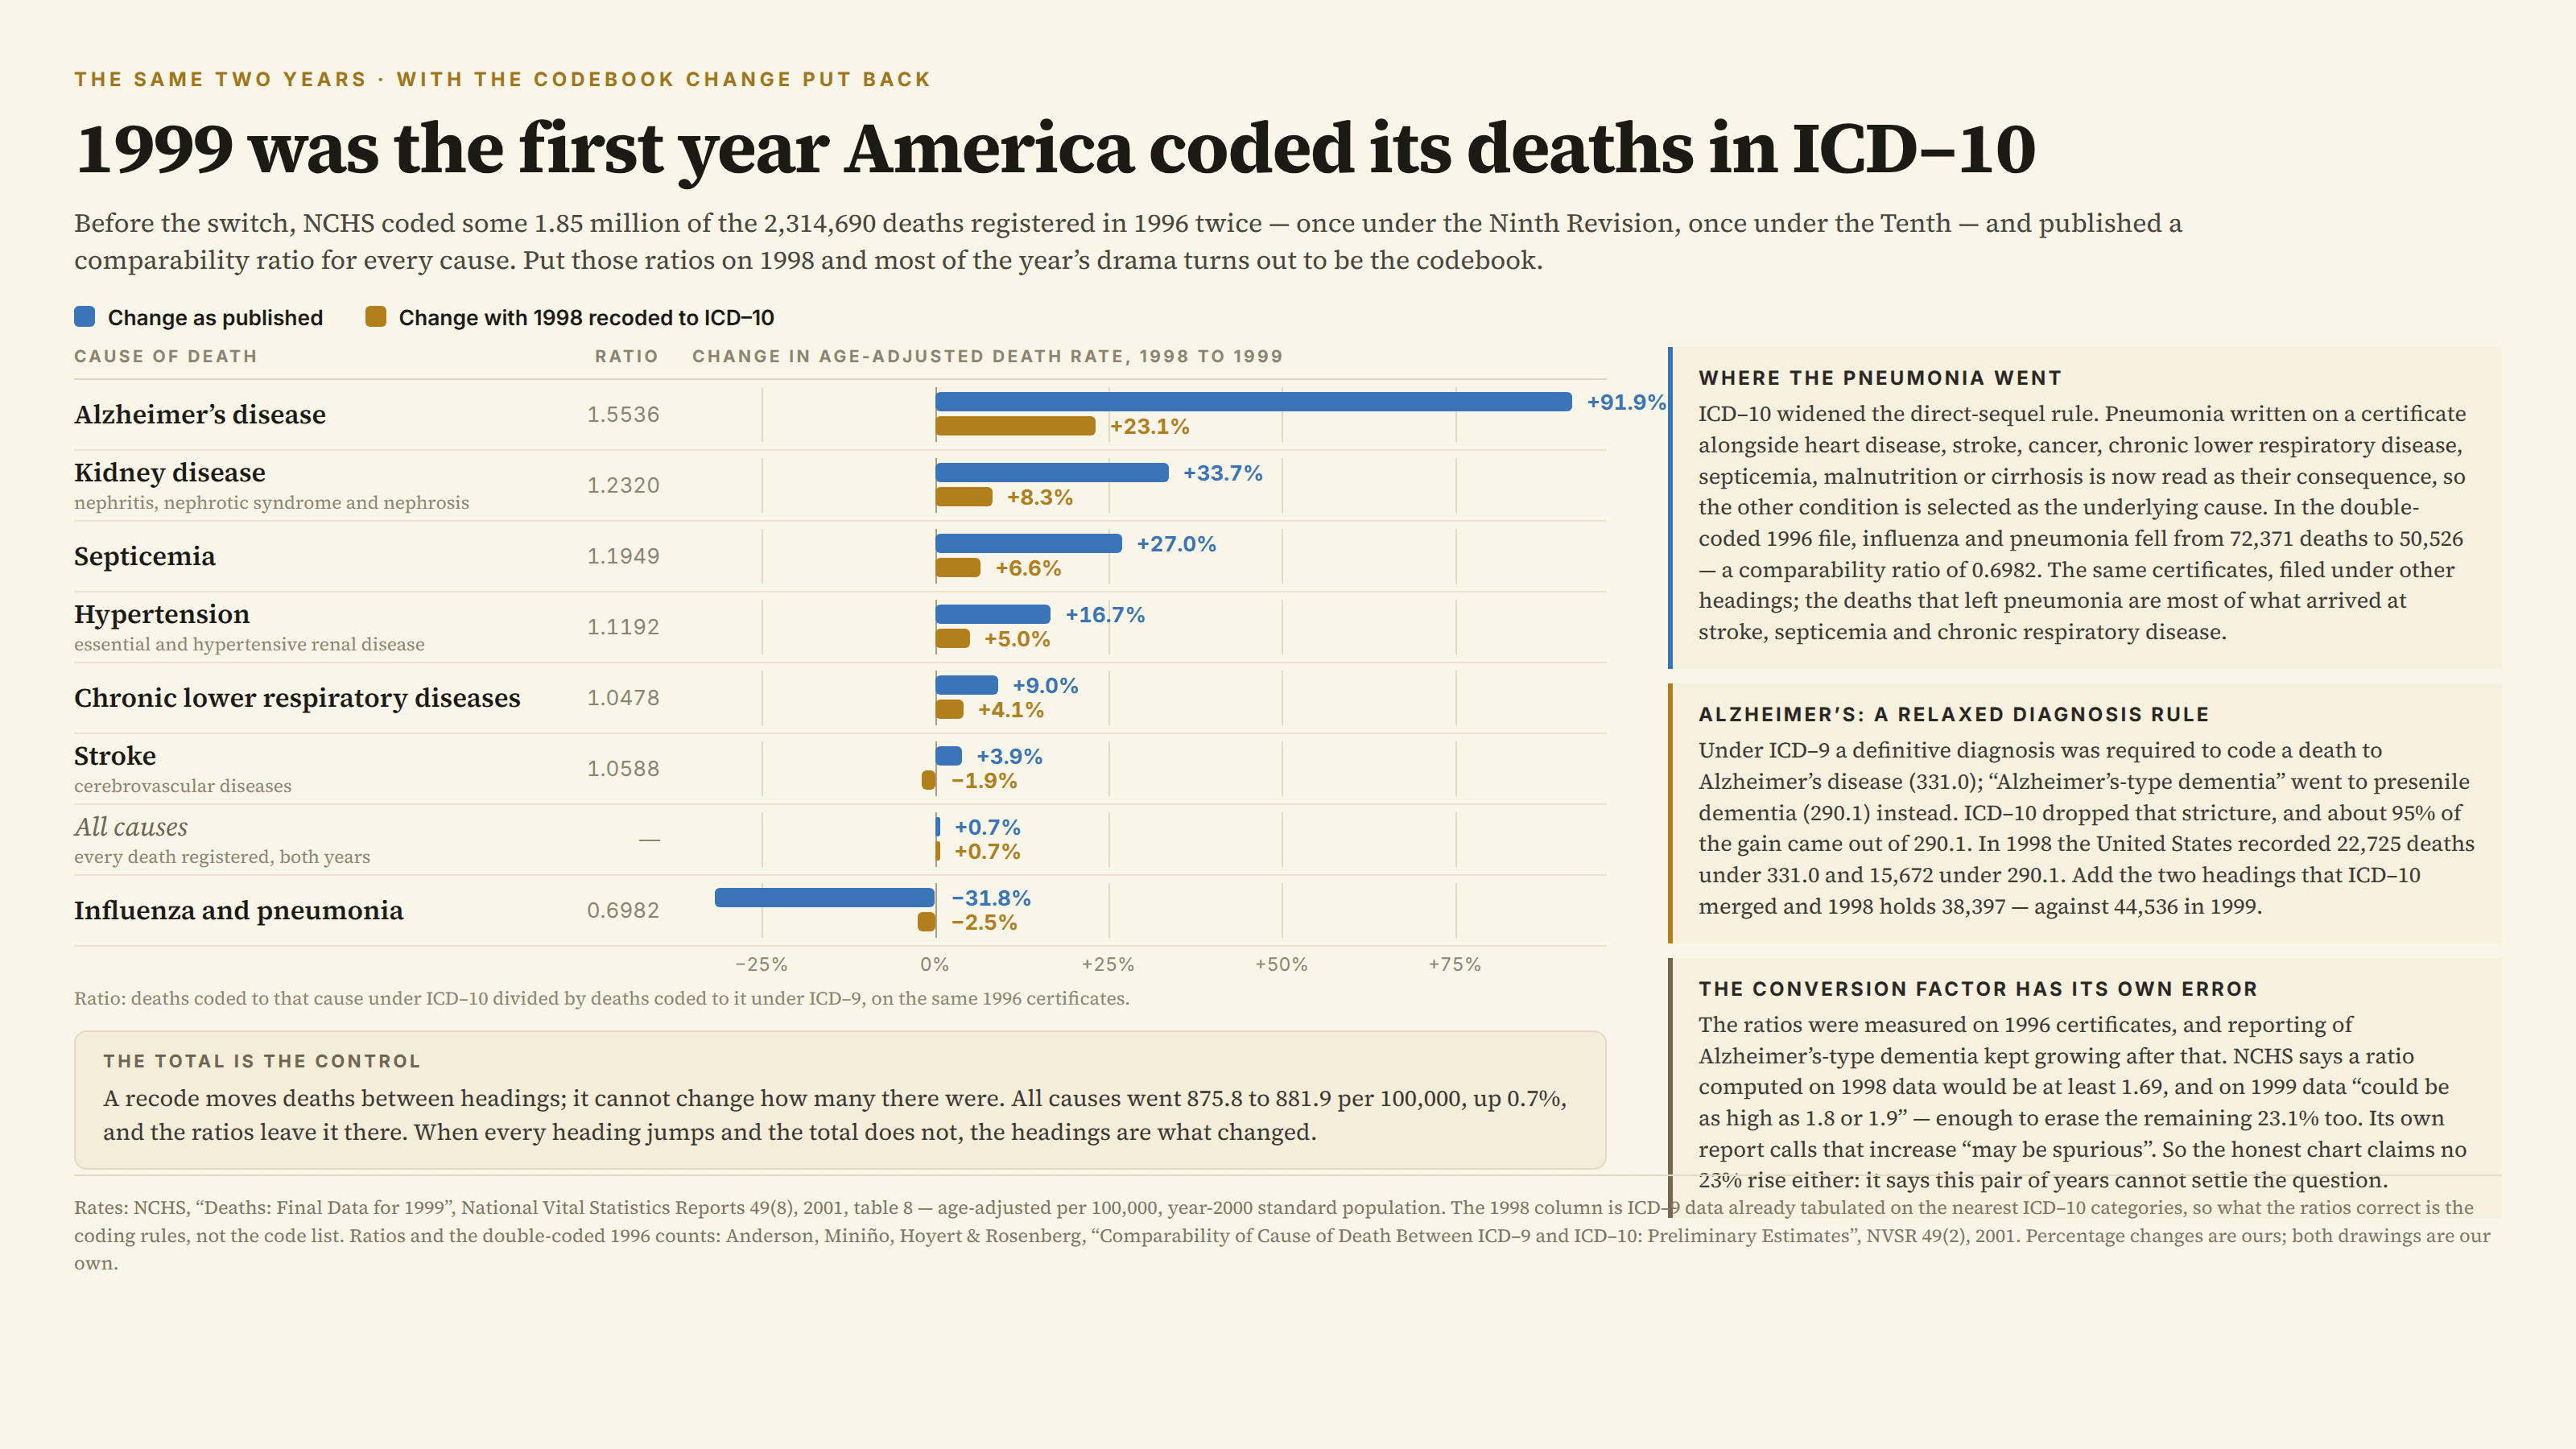
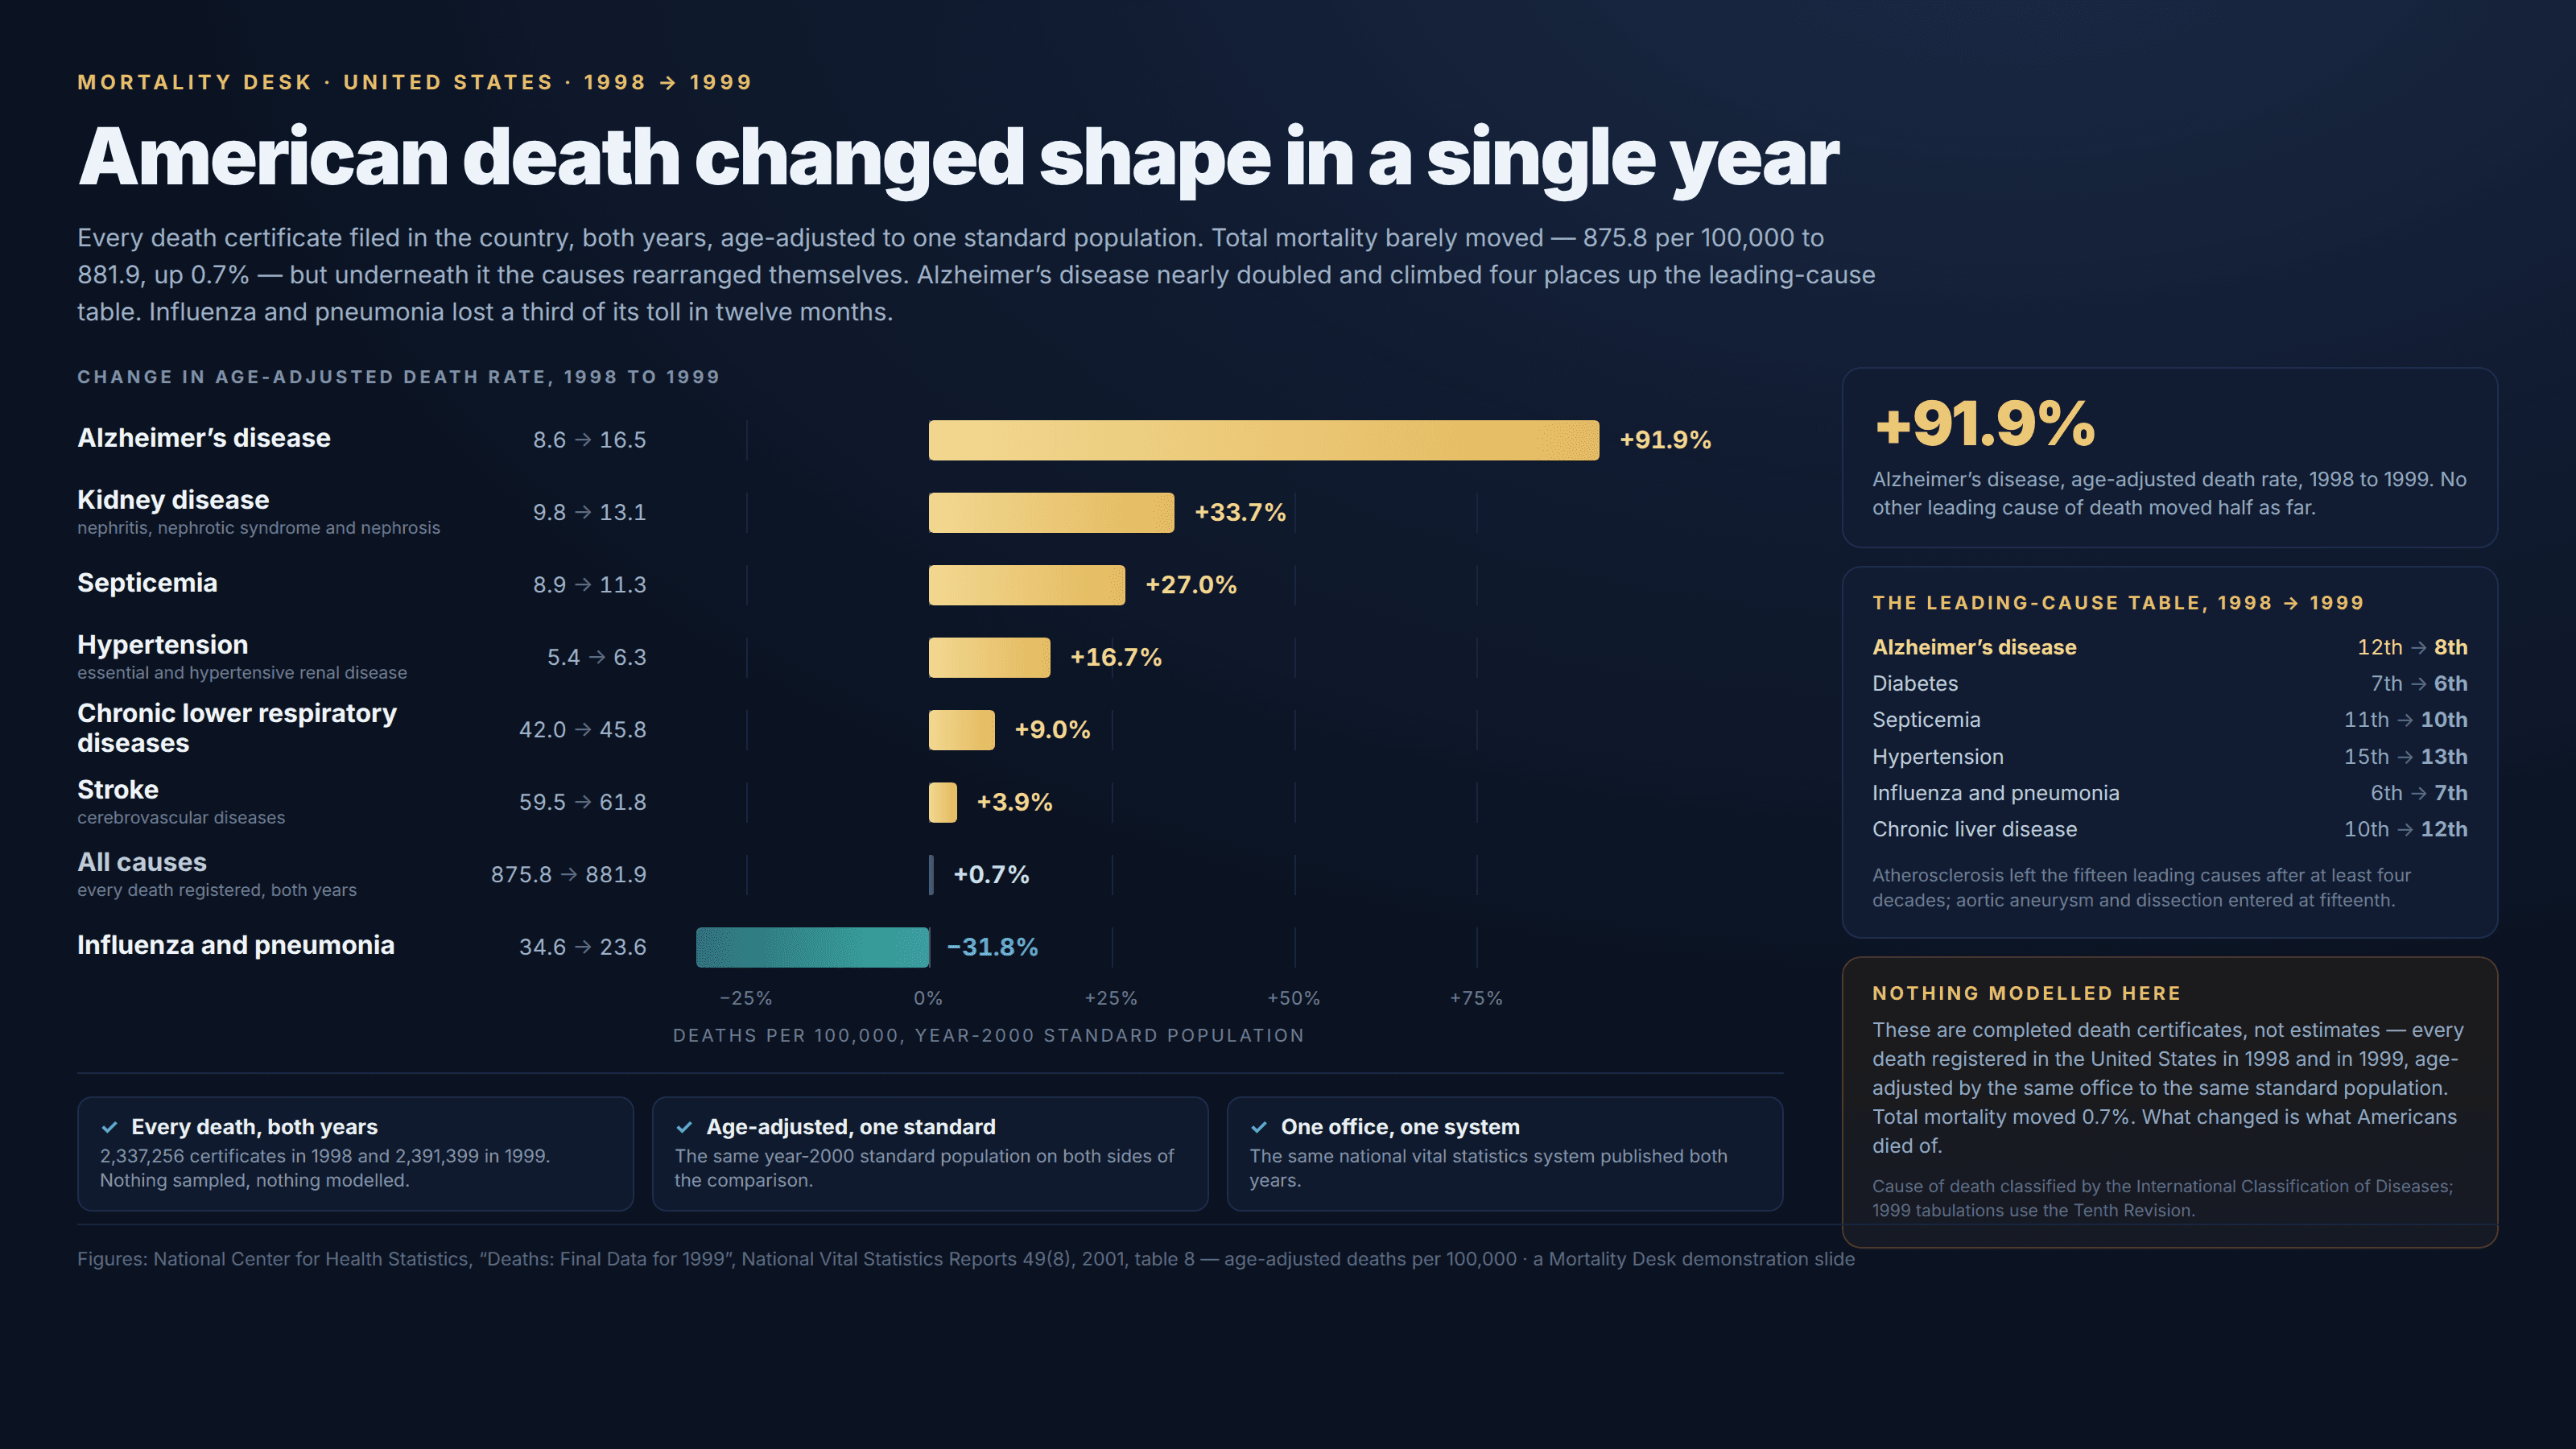
- Check the total. A reclassification moves cases between categories, so when every category jumps and the total does not, the categories are what changed.
- The jump beats the trend. A series that drifts a few percent a year does not gain half its value in twelve months on its own.
- Ask whether every category moved in the same direction. A real shock pushes one way; a recode has winners and losers, because the cases that left one heading arrived at another.
The fix
Break the line where the definition broke, and label the break. Where the publisher has measured the discontinuity — statistical agencies often do, by coding the same records both ways and publishing a conversion factor — apply it and show both versions, so the reader can see how much of the move was the world and how much was the rulebook. Treat that factor as a measurement rather than a constant: it was estimated on a particular year’s records and carries its own error. If no conversion exists, the honest chart is two series that stop and start, plus a sentence about why they cannot be joined.
In the gallery