All techniques
Framing & context
The mean of a long tail
One billionaire walks into the bar, and the average drinker is a millionaire.
a.k.a. mean versus median · the average nobody gets · the billionaire in the bar · skewed distribution · heavy tail · outlier-driven average · average salary · average citations · impact factor · per-head average · the typical case
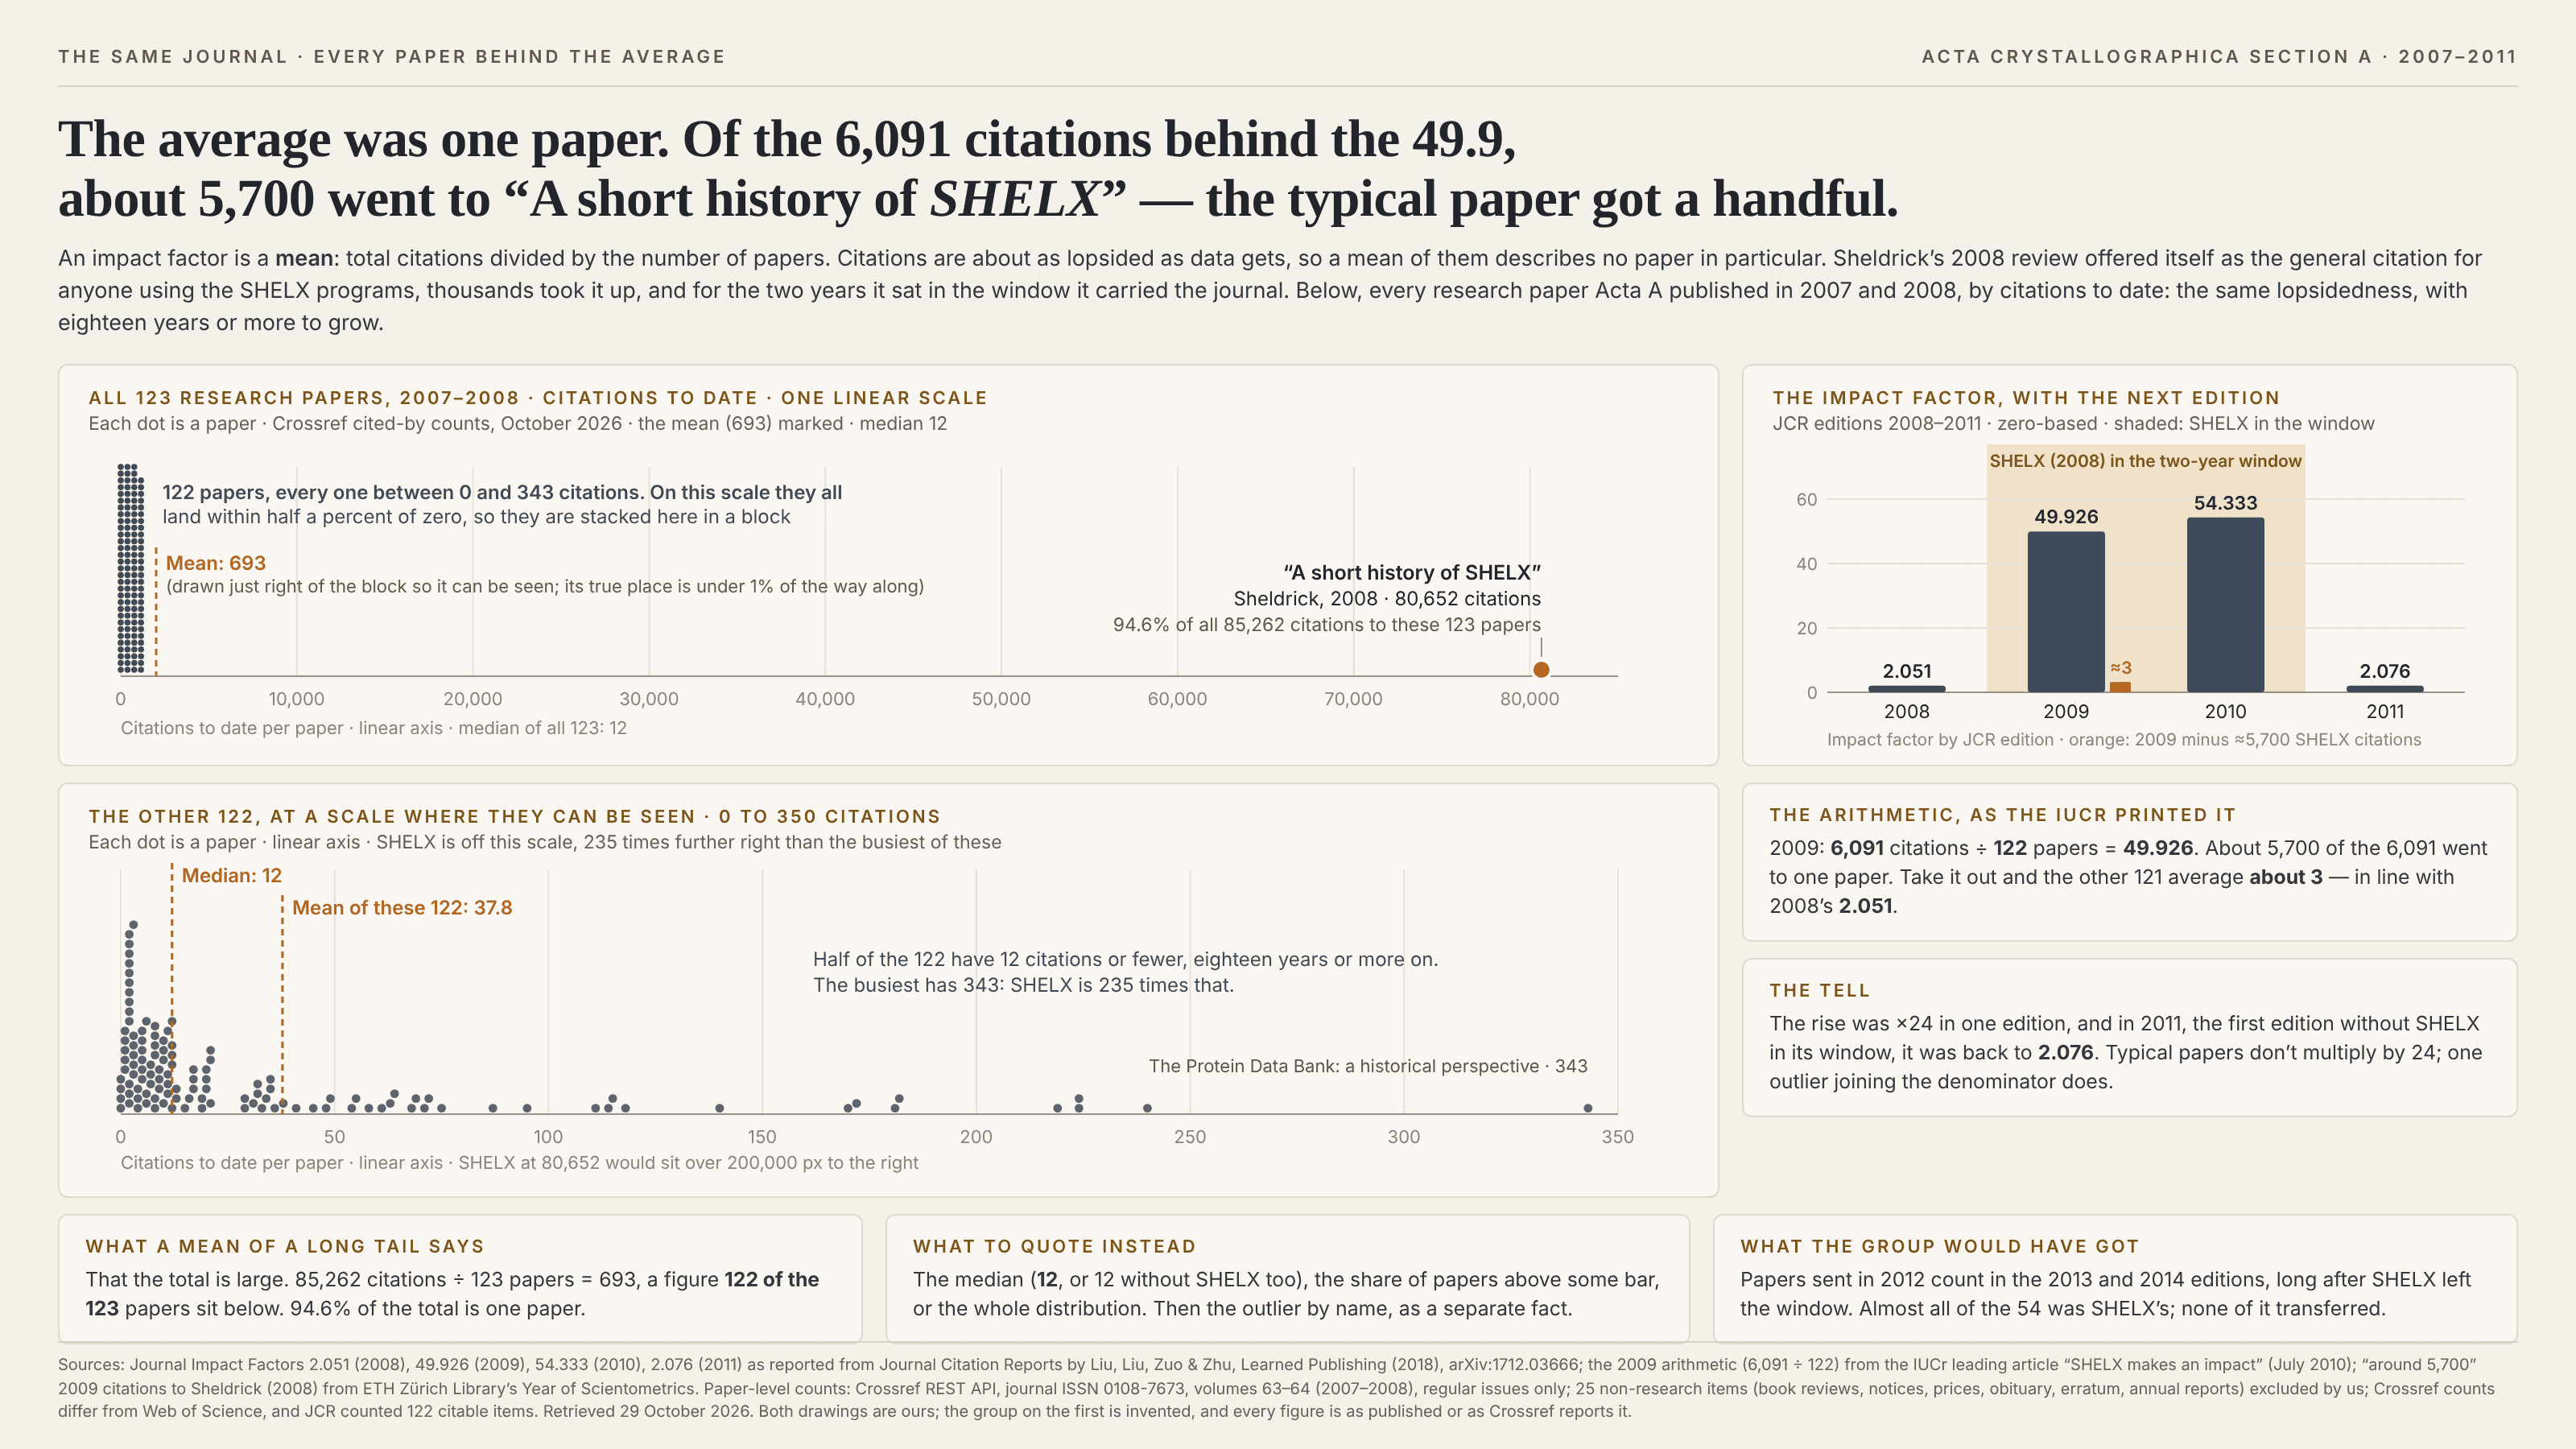
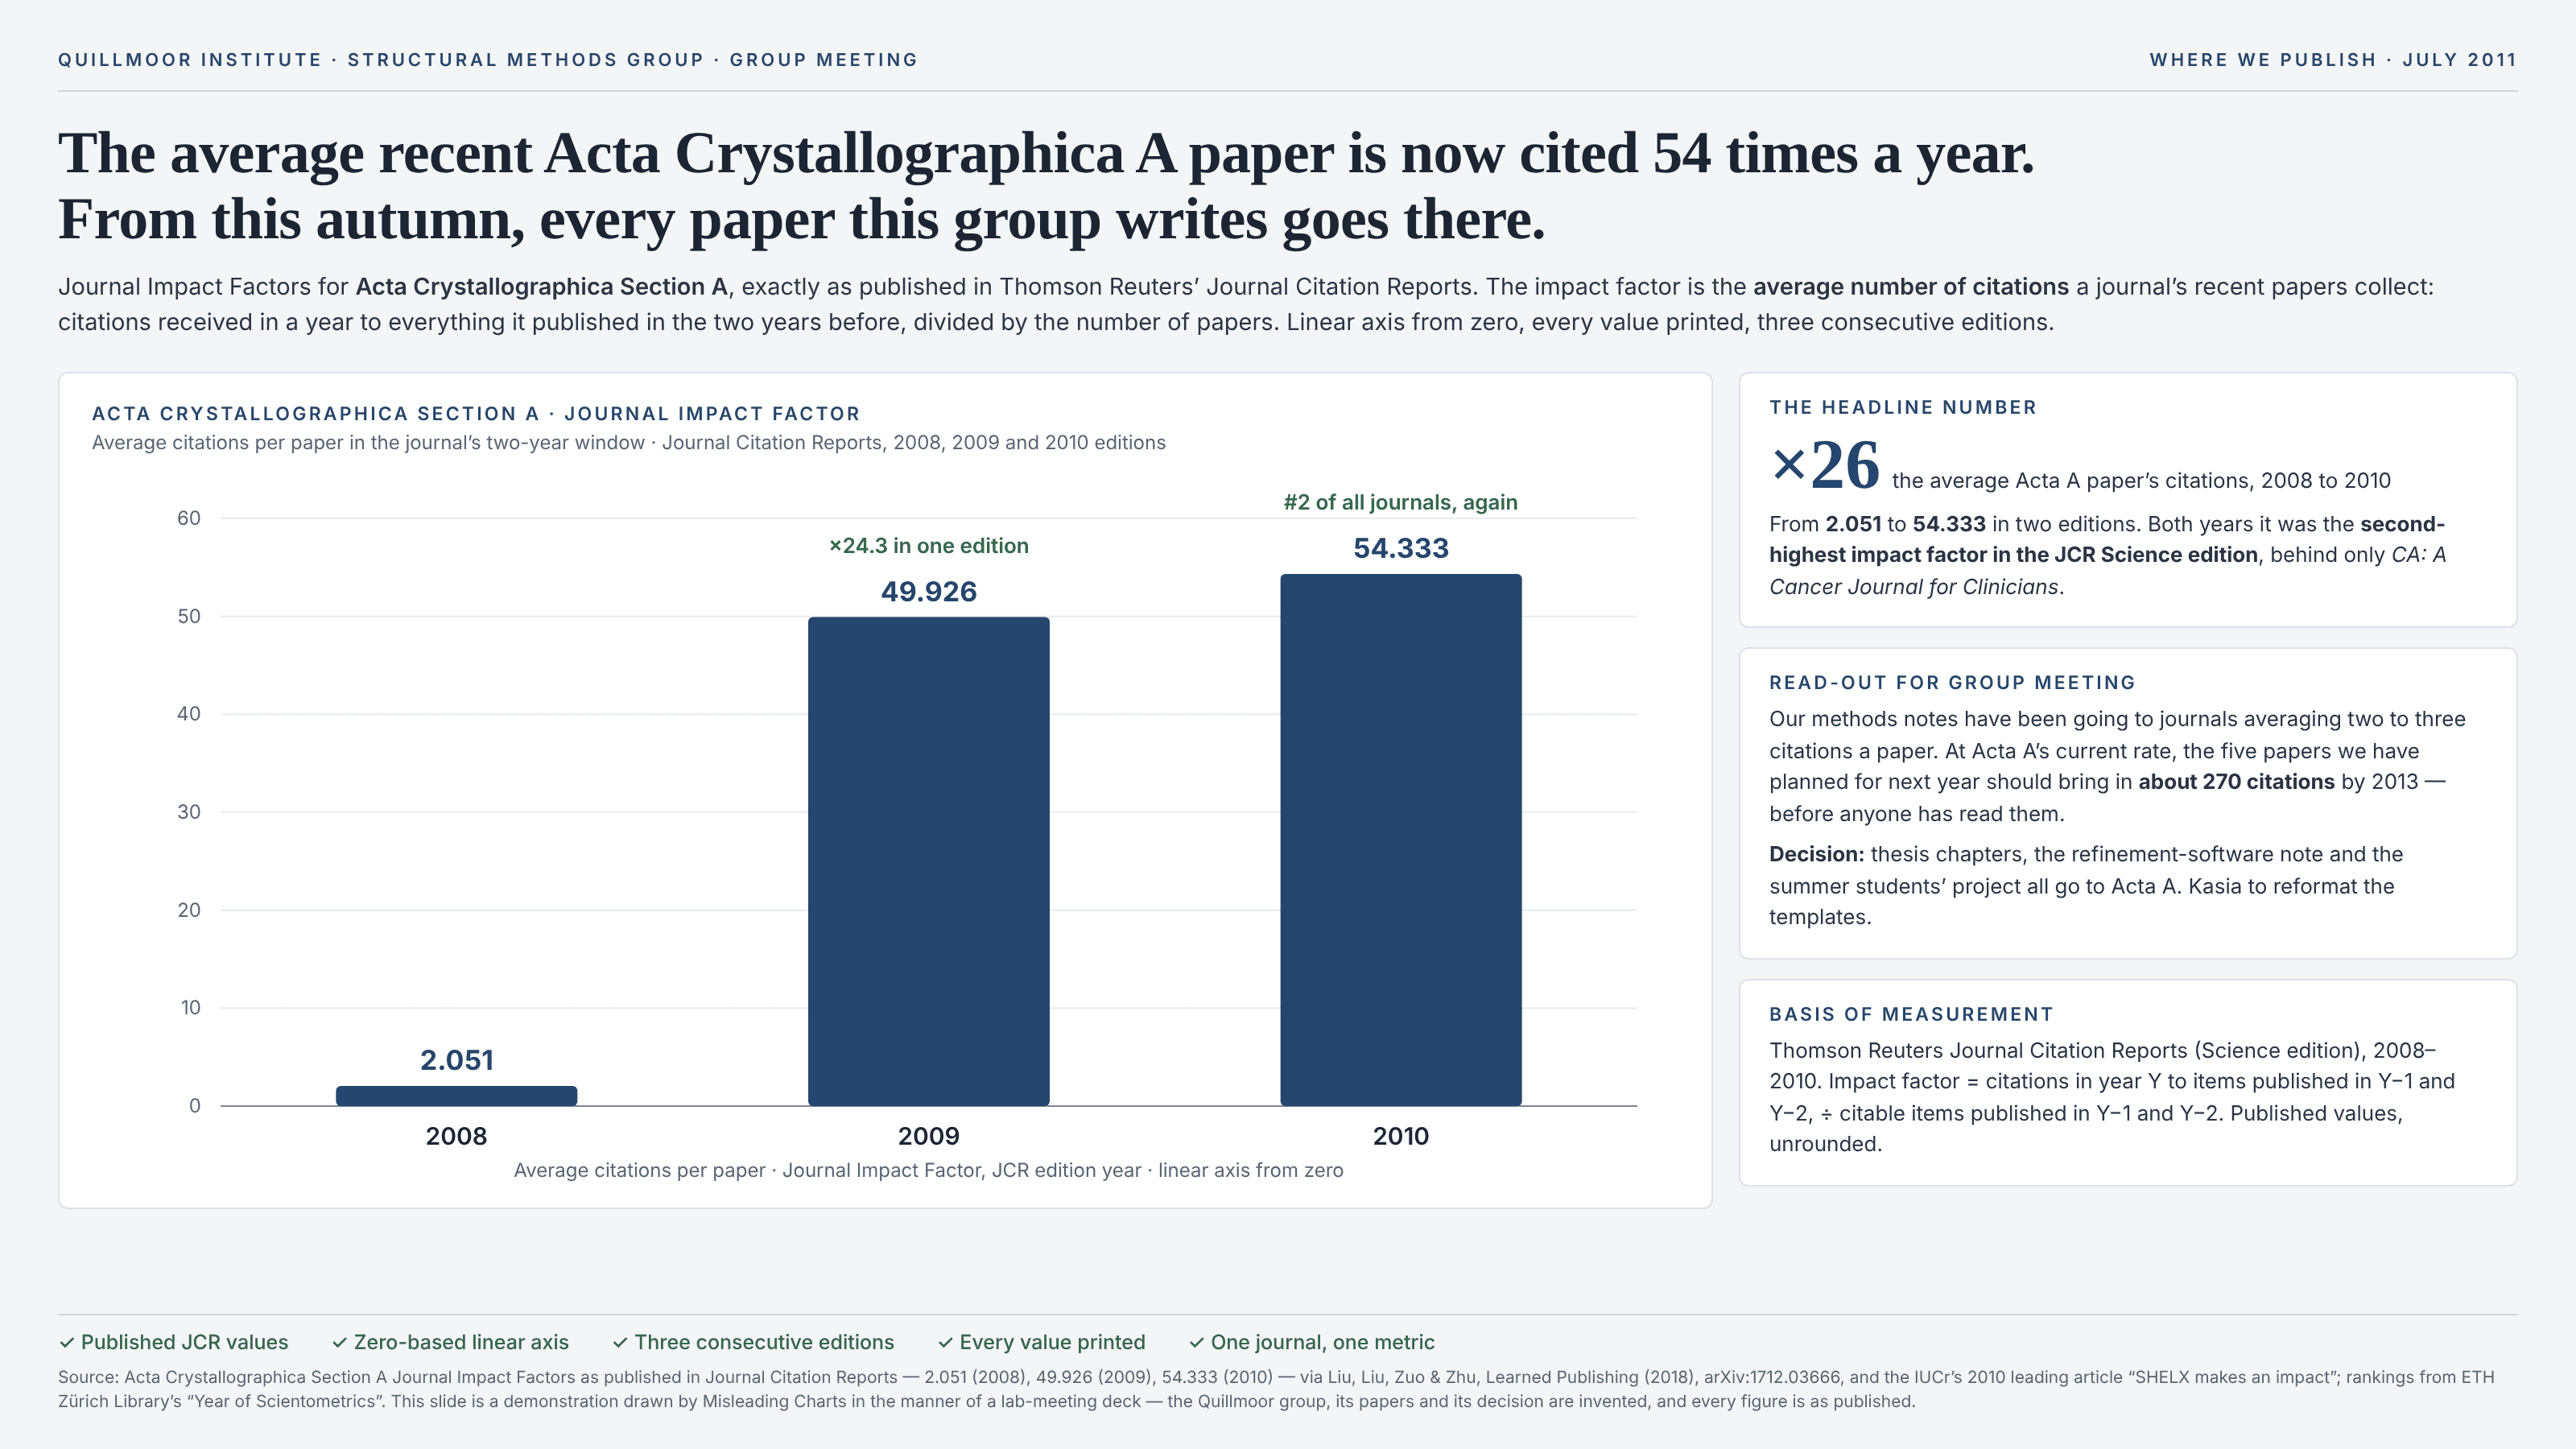
An average is a total divided by a count, and it is only a good stand-in for a typical member when the members are roughly alike. Plenty of quantities are nothing of the kind: incomes, citations, house prices, file sizes, insurance claims, followers, the takings of films and apps. There most items are small, a few are enormous, and the mean is pulled toward the enormous ones — often so far that almost every item sits below it. A chart that plots that mean and labels it “the average X” reads as a statement about a typical X, and it is really a statement about the total, divided evenly among members who did not share it evenly. The trouble grows when the mean is followed over time or compared across groups, because a single new arrival in the tail moves the whole figure: the mean leaps while every ordinary member stays where it was, and the chart draws one item’s fortune as everyone’s. Nothing in the arithmetic is wrong. The error is in the word “average” being read as “typical”, and in a summary that cannot tell the reader whether the number came from many items or one.
How to spot it
- Ask what kind of quantity is being averaged. Money, citations, followers, sales, sizes and anything else that can grow by multiplying tend to have long right tails, and a mean of them should come with its median.
- A mean that jumps while the members do not. If an average doubles in a year, ask whether most items doubled or one new item arrived; with small groups and long tails it is nearly always the second.
- Small denominators. The fewer items behind a mean, the more one extreme item can carry it: a journal of a hundred papers, a team of ten, a street of twenty houses.
- Look for the median, or for the share of items above the mean. When most items sit below the average, the average is describing the tail.
- Rankings built on means of skewed data — journals by impact factor, schools by average graduate salary, funds by average return — reorder easily on one item, and the order says little about a typical member.
- Keep it apart from the missing denominator and the gross figure: there the count or the subtraction is what is missing. Here every number is present and correct, and the issue is which summary of them was chosen. Its statistical neighbour is the size-biased count, where the big items are over-sampled; here every item is counted once, and the big ones simply outweigh the rest in the sum.
The fix
Show the distribution, or at least the median beside the mean, and say which one the headline uses. A strip of dots, one per item, on a scale wide enough for the extremes makes the shape impossible to miss; where the extreme items squash everyone else into a corner, draw them on their own and give the rest a second panel at a scale where they can be seen. Name the outliers and report them as separate facts, rather than letting them disappear into a per-head figure. When the question really is about totals — how much was earned, how often a journal was cited — the mean is fine, and the honest move is to call it a total per head rather than “the average X”. When the question is about a typical member, quote the median, the share above a meaningful threshold, or a trimmed figure, and check how far the mean moves when the largest item is taken out: if it moves a lot, the mean was mostly that item.
In the gallery