All techniques
Cherry-picking
The late denominator
Start counting at step three and everybody who failed at step two leaves the fraction.
a.k.a. per-protocol analysis · completers-only analysis · the analysis set · denominator shopping · the moved denominator · conversion from the middle of the funnel · the surviving denominator
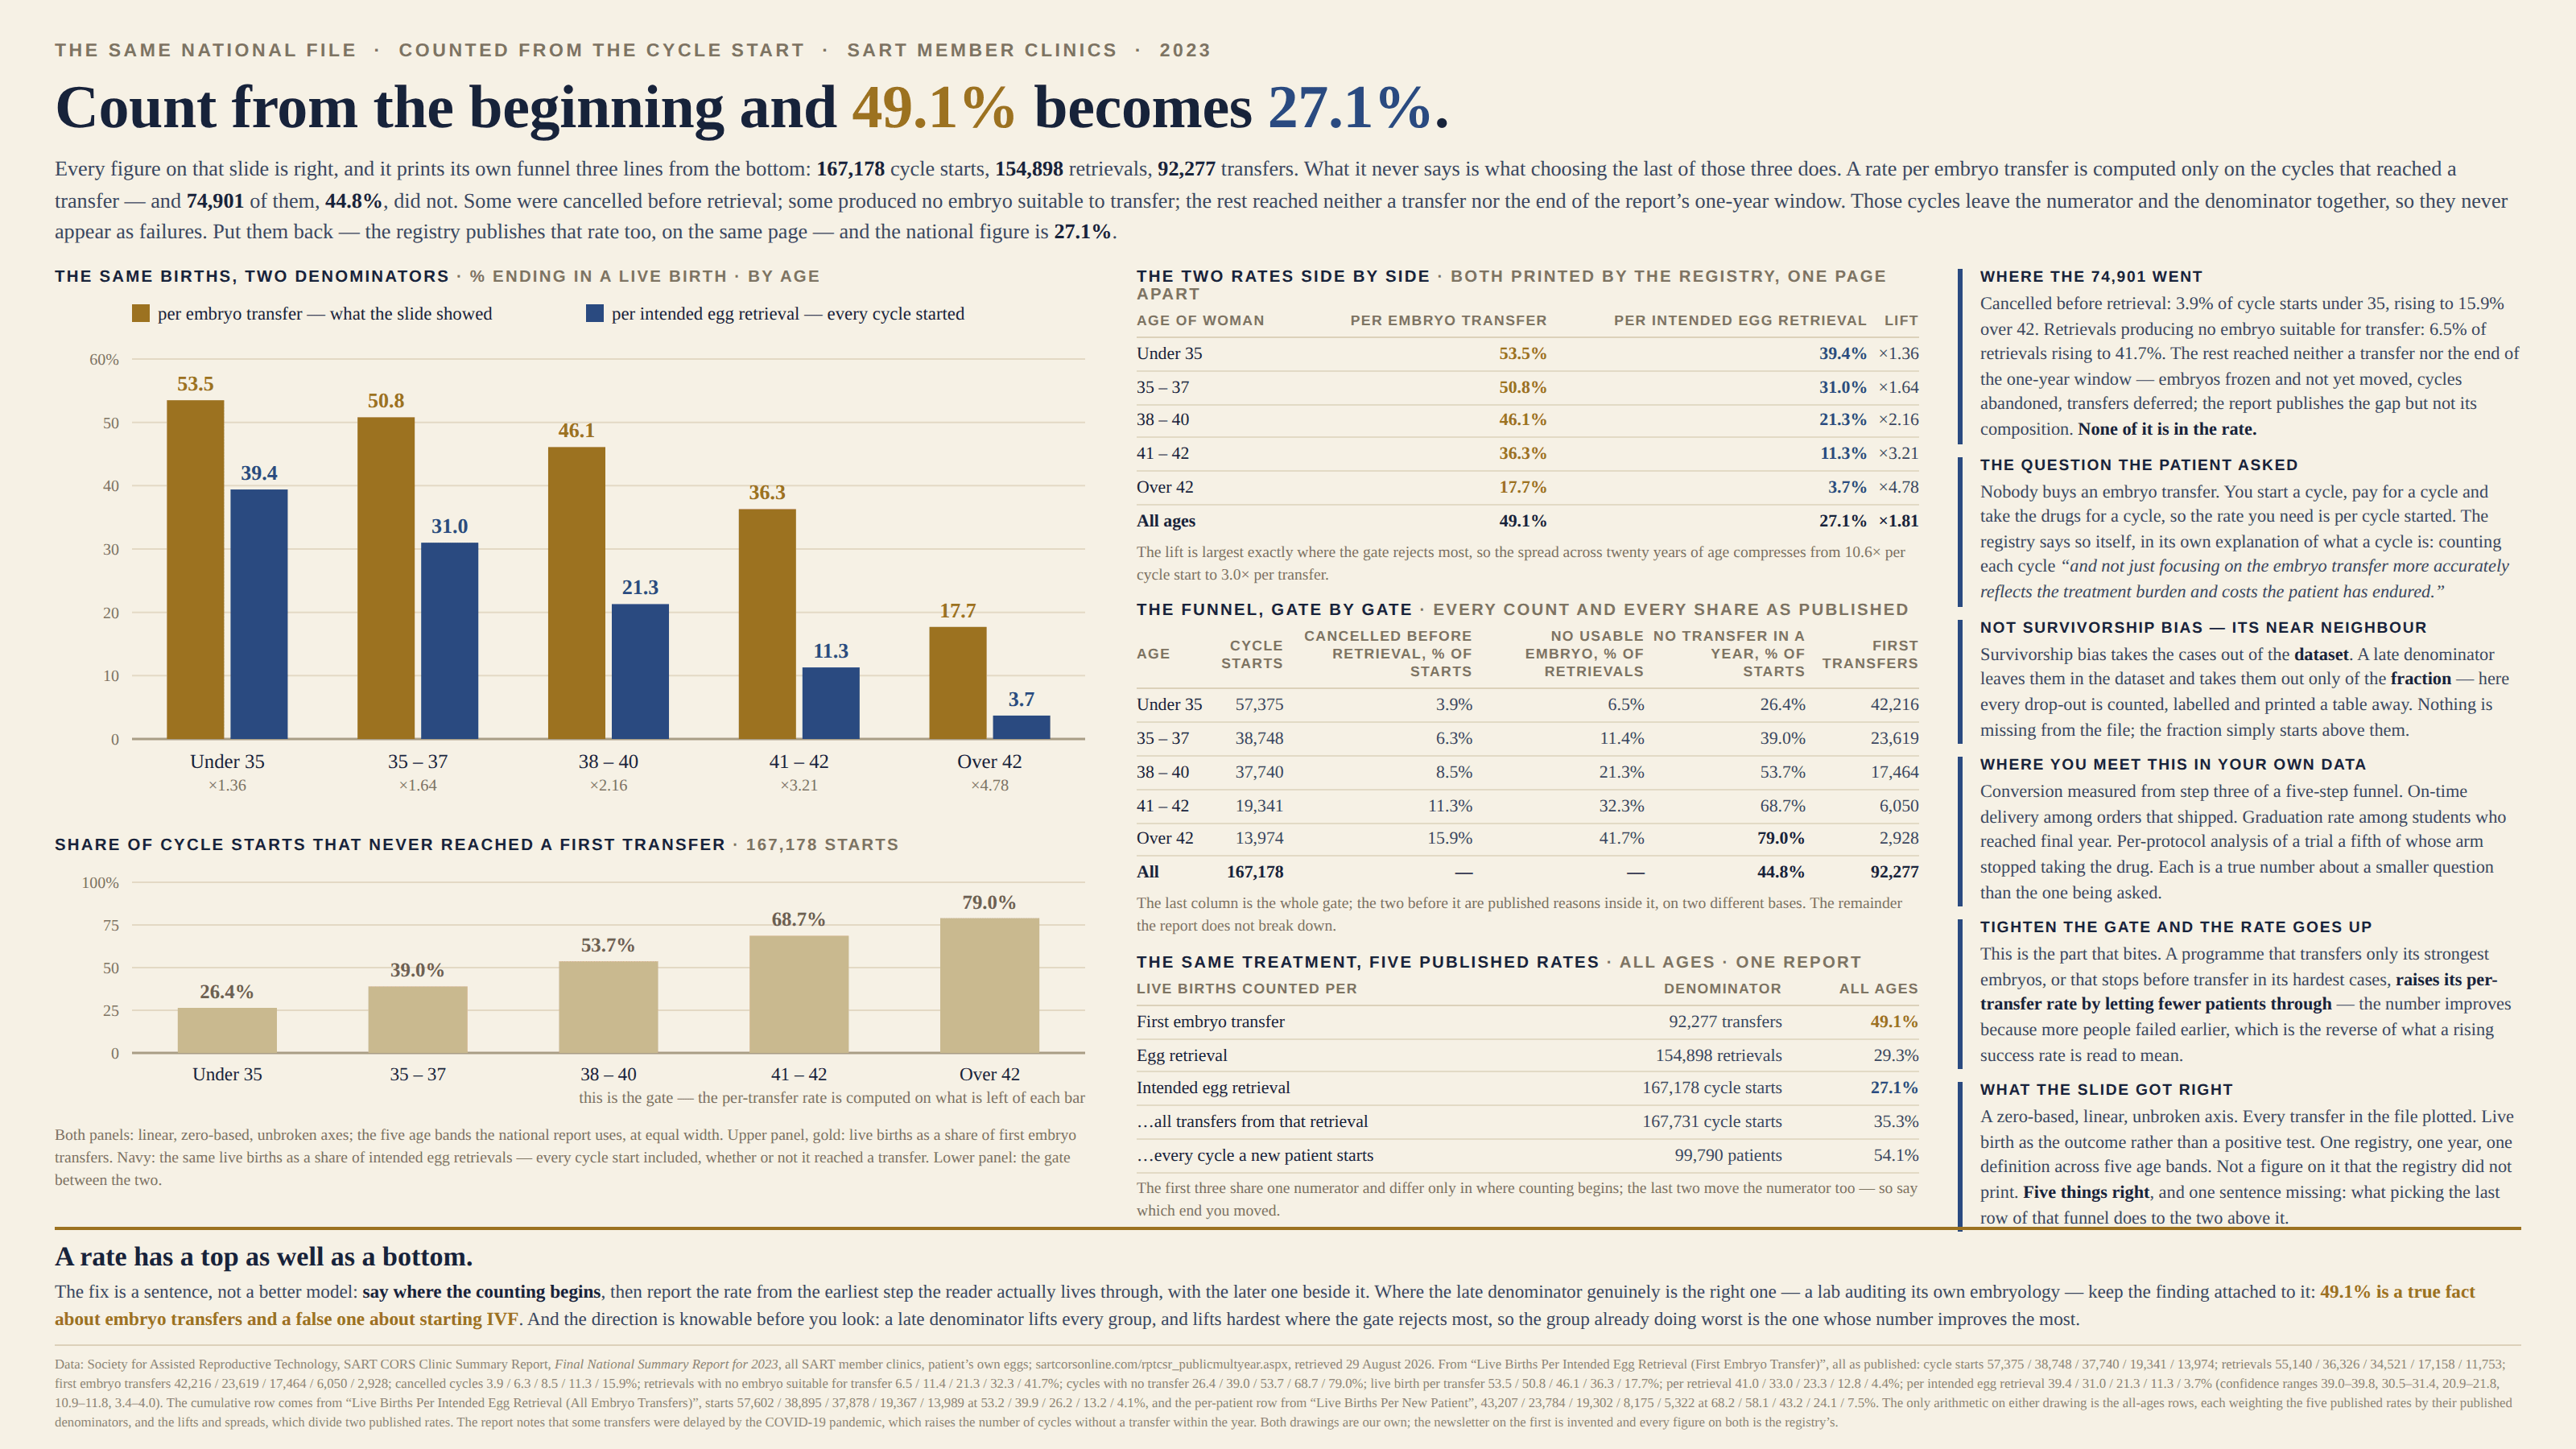
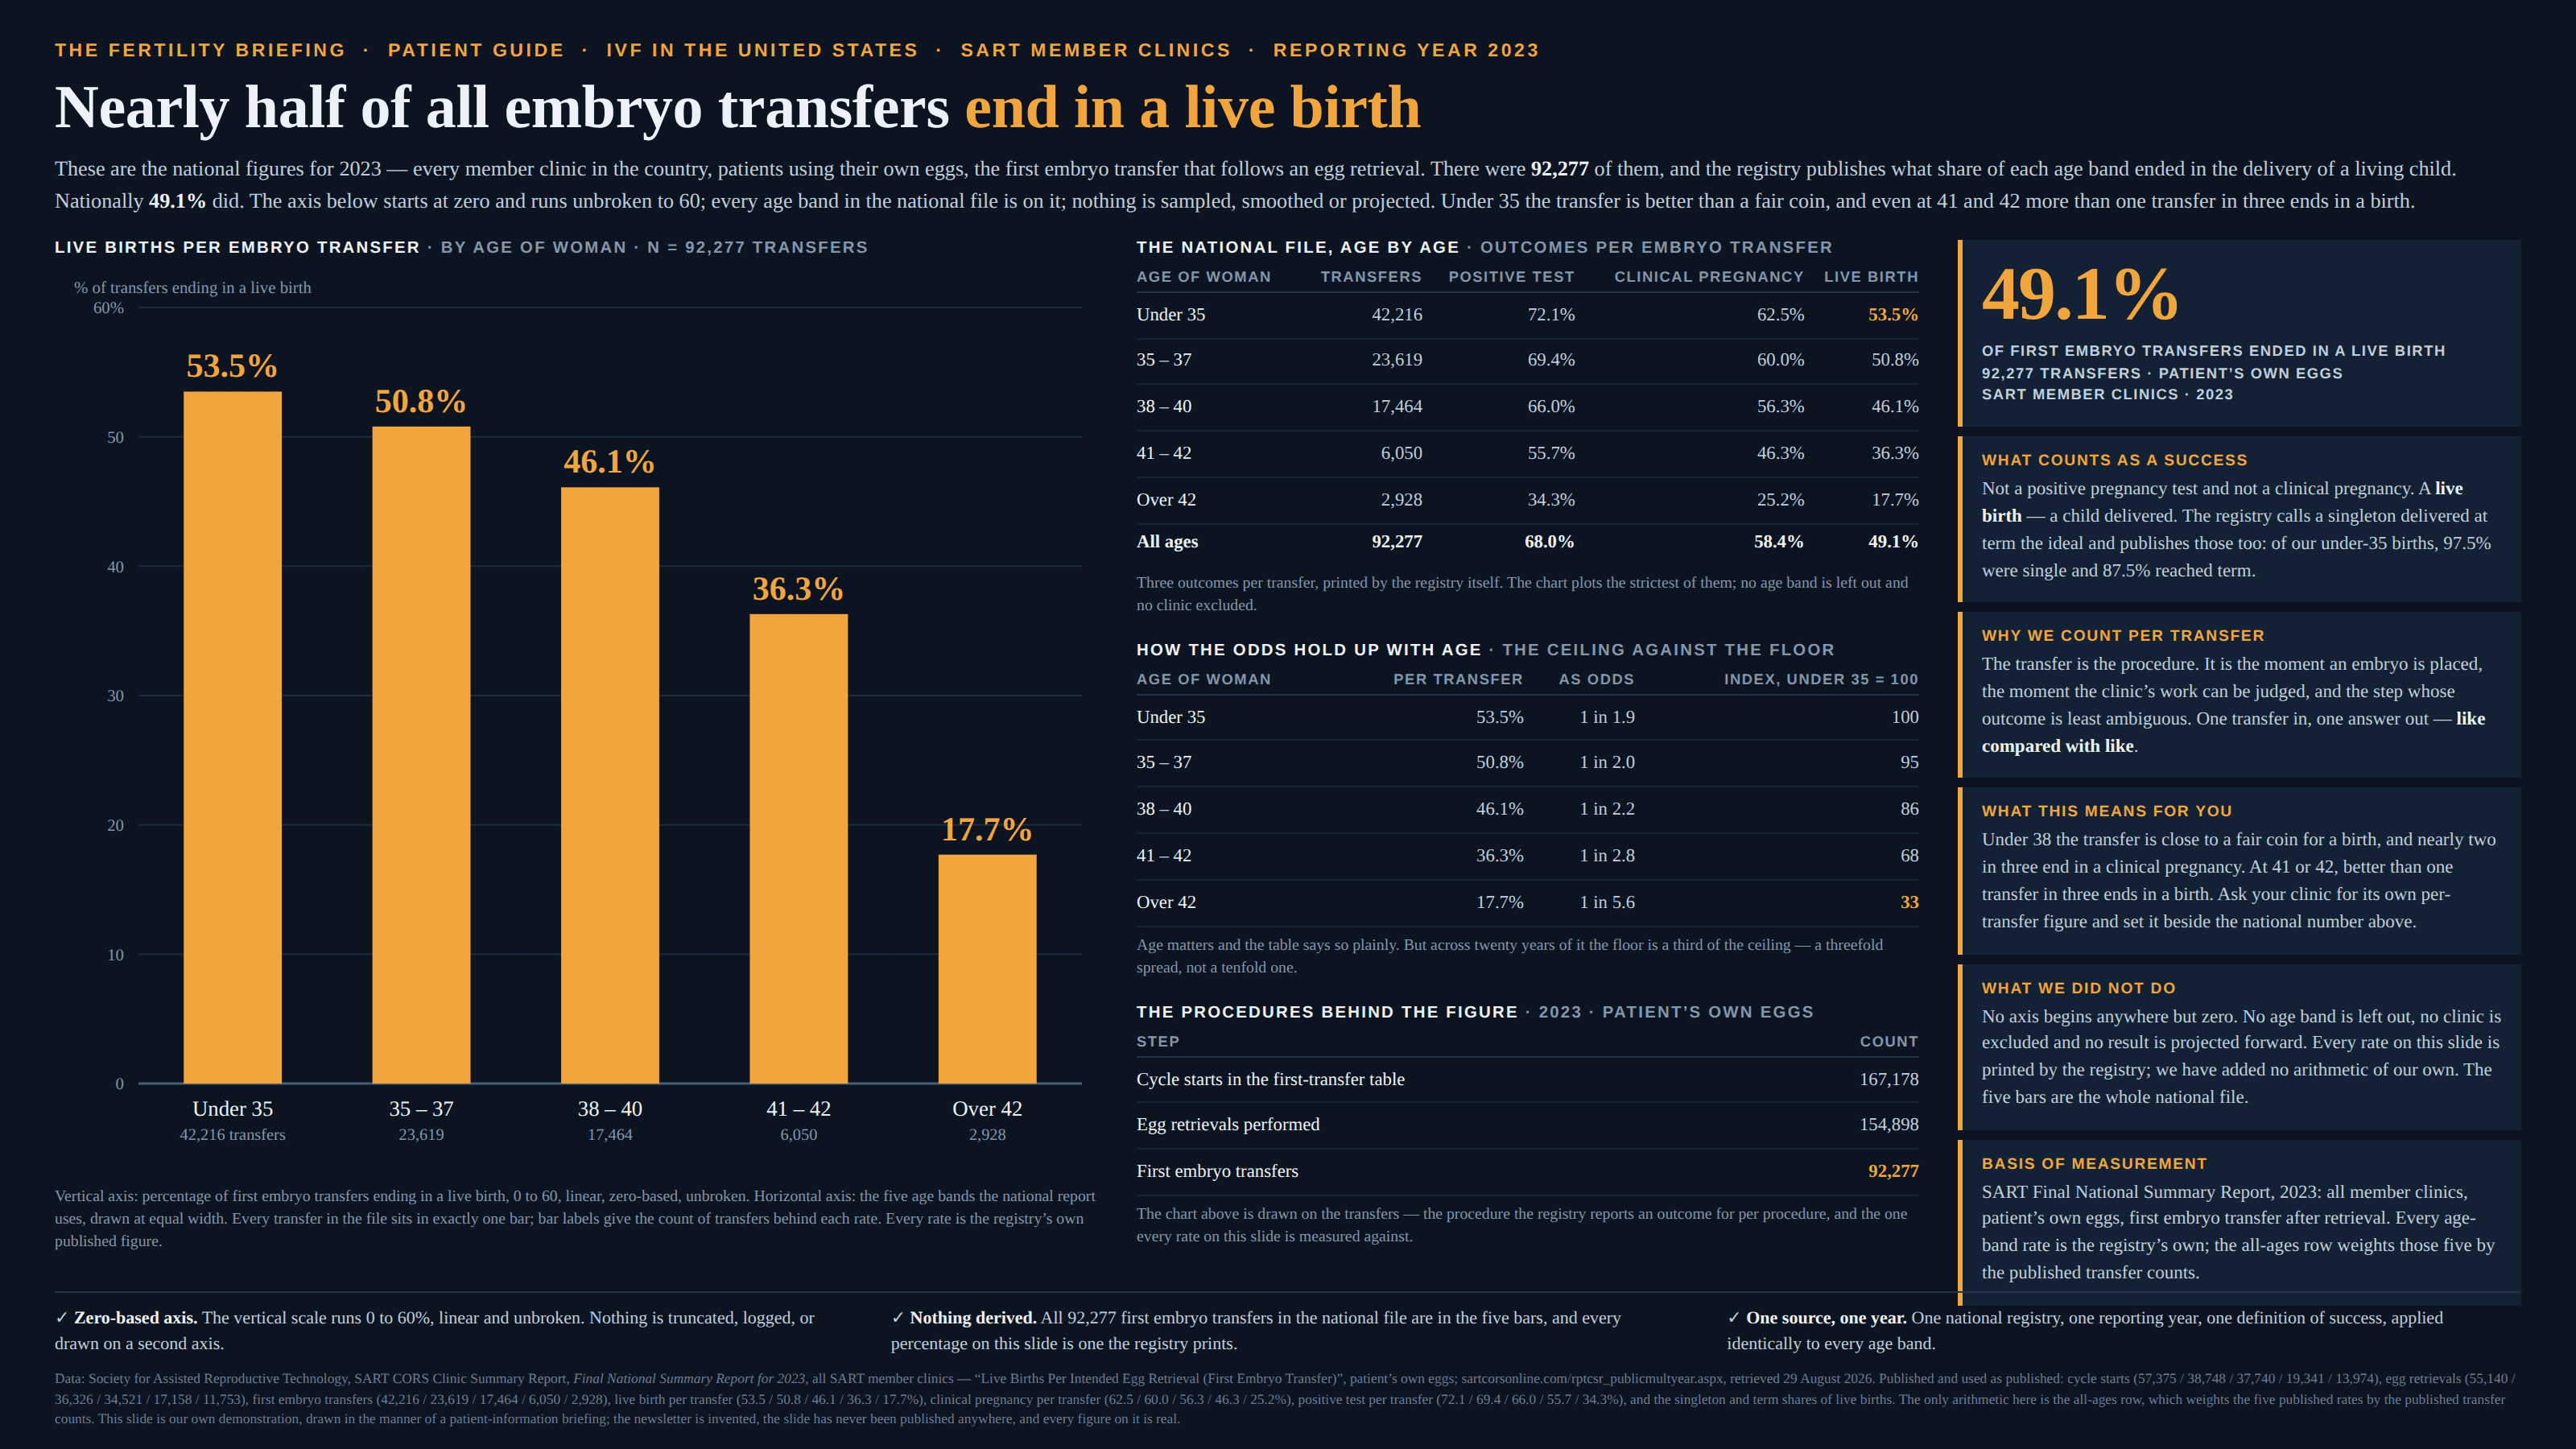
Every rate is a fraction, and a fraction has a top as well as a bottom: somewhere in the process, counting begins. Move that starting line further down the pipeline, past a gate some cases fail to clear, and those cases leave the numerator and the denominator together — so the rate rises without a single outcome improving. Nothing is hidden and nobody is deleted, which is what sets it apart from survivorship bias: survivorship takes the cases out of the dataset, while a late denominator leaves them in it and takes them out only of the fraction, usually a table away, counted and named. They have simply stopped being counted as attempts. The lift is never even, either. It is largest wherever the gate rejects most, which is to say among the cases that were already doing worst, so the same move that raises the headline also flattens the differences the chart was drawn to show.
How to spot it
- Read the denominator out loud. “Per transfer”, “of those who completed”, “among orders that shipped”, “of students who reached final year” — each names a step, and every step before it is a place where cases left.
- Ask what a case had to do to reach the denominator, then ask whether doing it was itself part of the outcome. If it was, the rate is measuring the survivors of the very thing it claims to measure.
- Find the funnel. A publisher using a late denominator has almost always printed the earlier counts somewhere on the same page — divide by the first one and see how far the number moves.
- A rate that improves when the process gets stricter. Tightening the gate raises a late-denominated rate by turning away the hardest cases, which is the reverse of what a rising success rate is read to mean.
- The worst-off group flattered most. Compare the lift group by group: if it grows as the group’s prospects shrink, the spread on the chart is a fact about the gate.
- In trials, the words “per-protocol” or “as-treated” with no intention-to-treat figure beside them; in dashboards, a conversion rate whose first step is not the first step.
The fix
Denominate at the decision. The rate worth printing is the one measured from the earliest step the reader actually lives through — the cycle they start, the order they place, the course they enrol in, the arm they were randomised to — because that is the question they brought, and every later denominator answers a smaller one. Keep the late rate too; it is genuinely the right measure for the step it names, and a lab auditing its own bench work needs it. Just never let it travel alone, and never let it wear the plain word “success rate”. Print the funnel beside both, gate by gate, with the count that entered and the count that survived, so the reader can see where the fraction starts rather than having to infer it. Then say the direction out loud, because it is knowable in advance: a later denominator lifts every group and lifts hardest where the gate rejects most, so a compressed spread between groups is the first thing to distrust. Watch the top of the fraction while you are down there, because publishers who offer several rates often move both ends at once — a rate that counts later attempts as well as earlier starts is a different measurement, not a fairer version of the same one, and the sentence that says which end moved is the one worth insisting on. And when the late denominator is the one the audience wants, keep the finding attached to it — a true fact about transfers is a false one about starting treatment, and the two sentences differ only in where they begin counting.
In the gallery