All techniques
Cherry-picking
The file drawer
A chart of the evidence is a chart of the evidence somebody wrote up.
a.k.a. publication bias · the file-drawer problem · selective publication · selection on significance · the missing null results · outcome switching · funnel plot asymmetry · reporting bias · the unpublished trial · the drawer
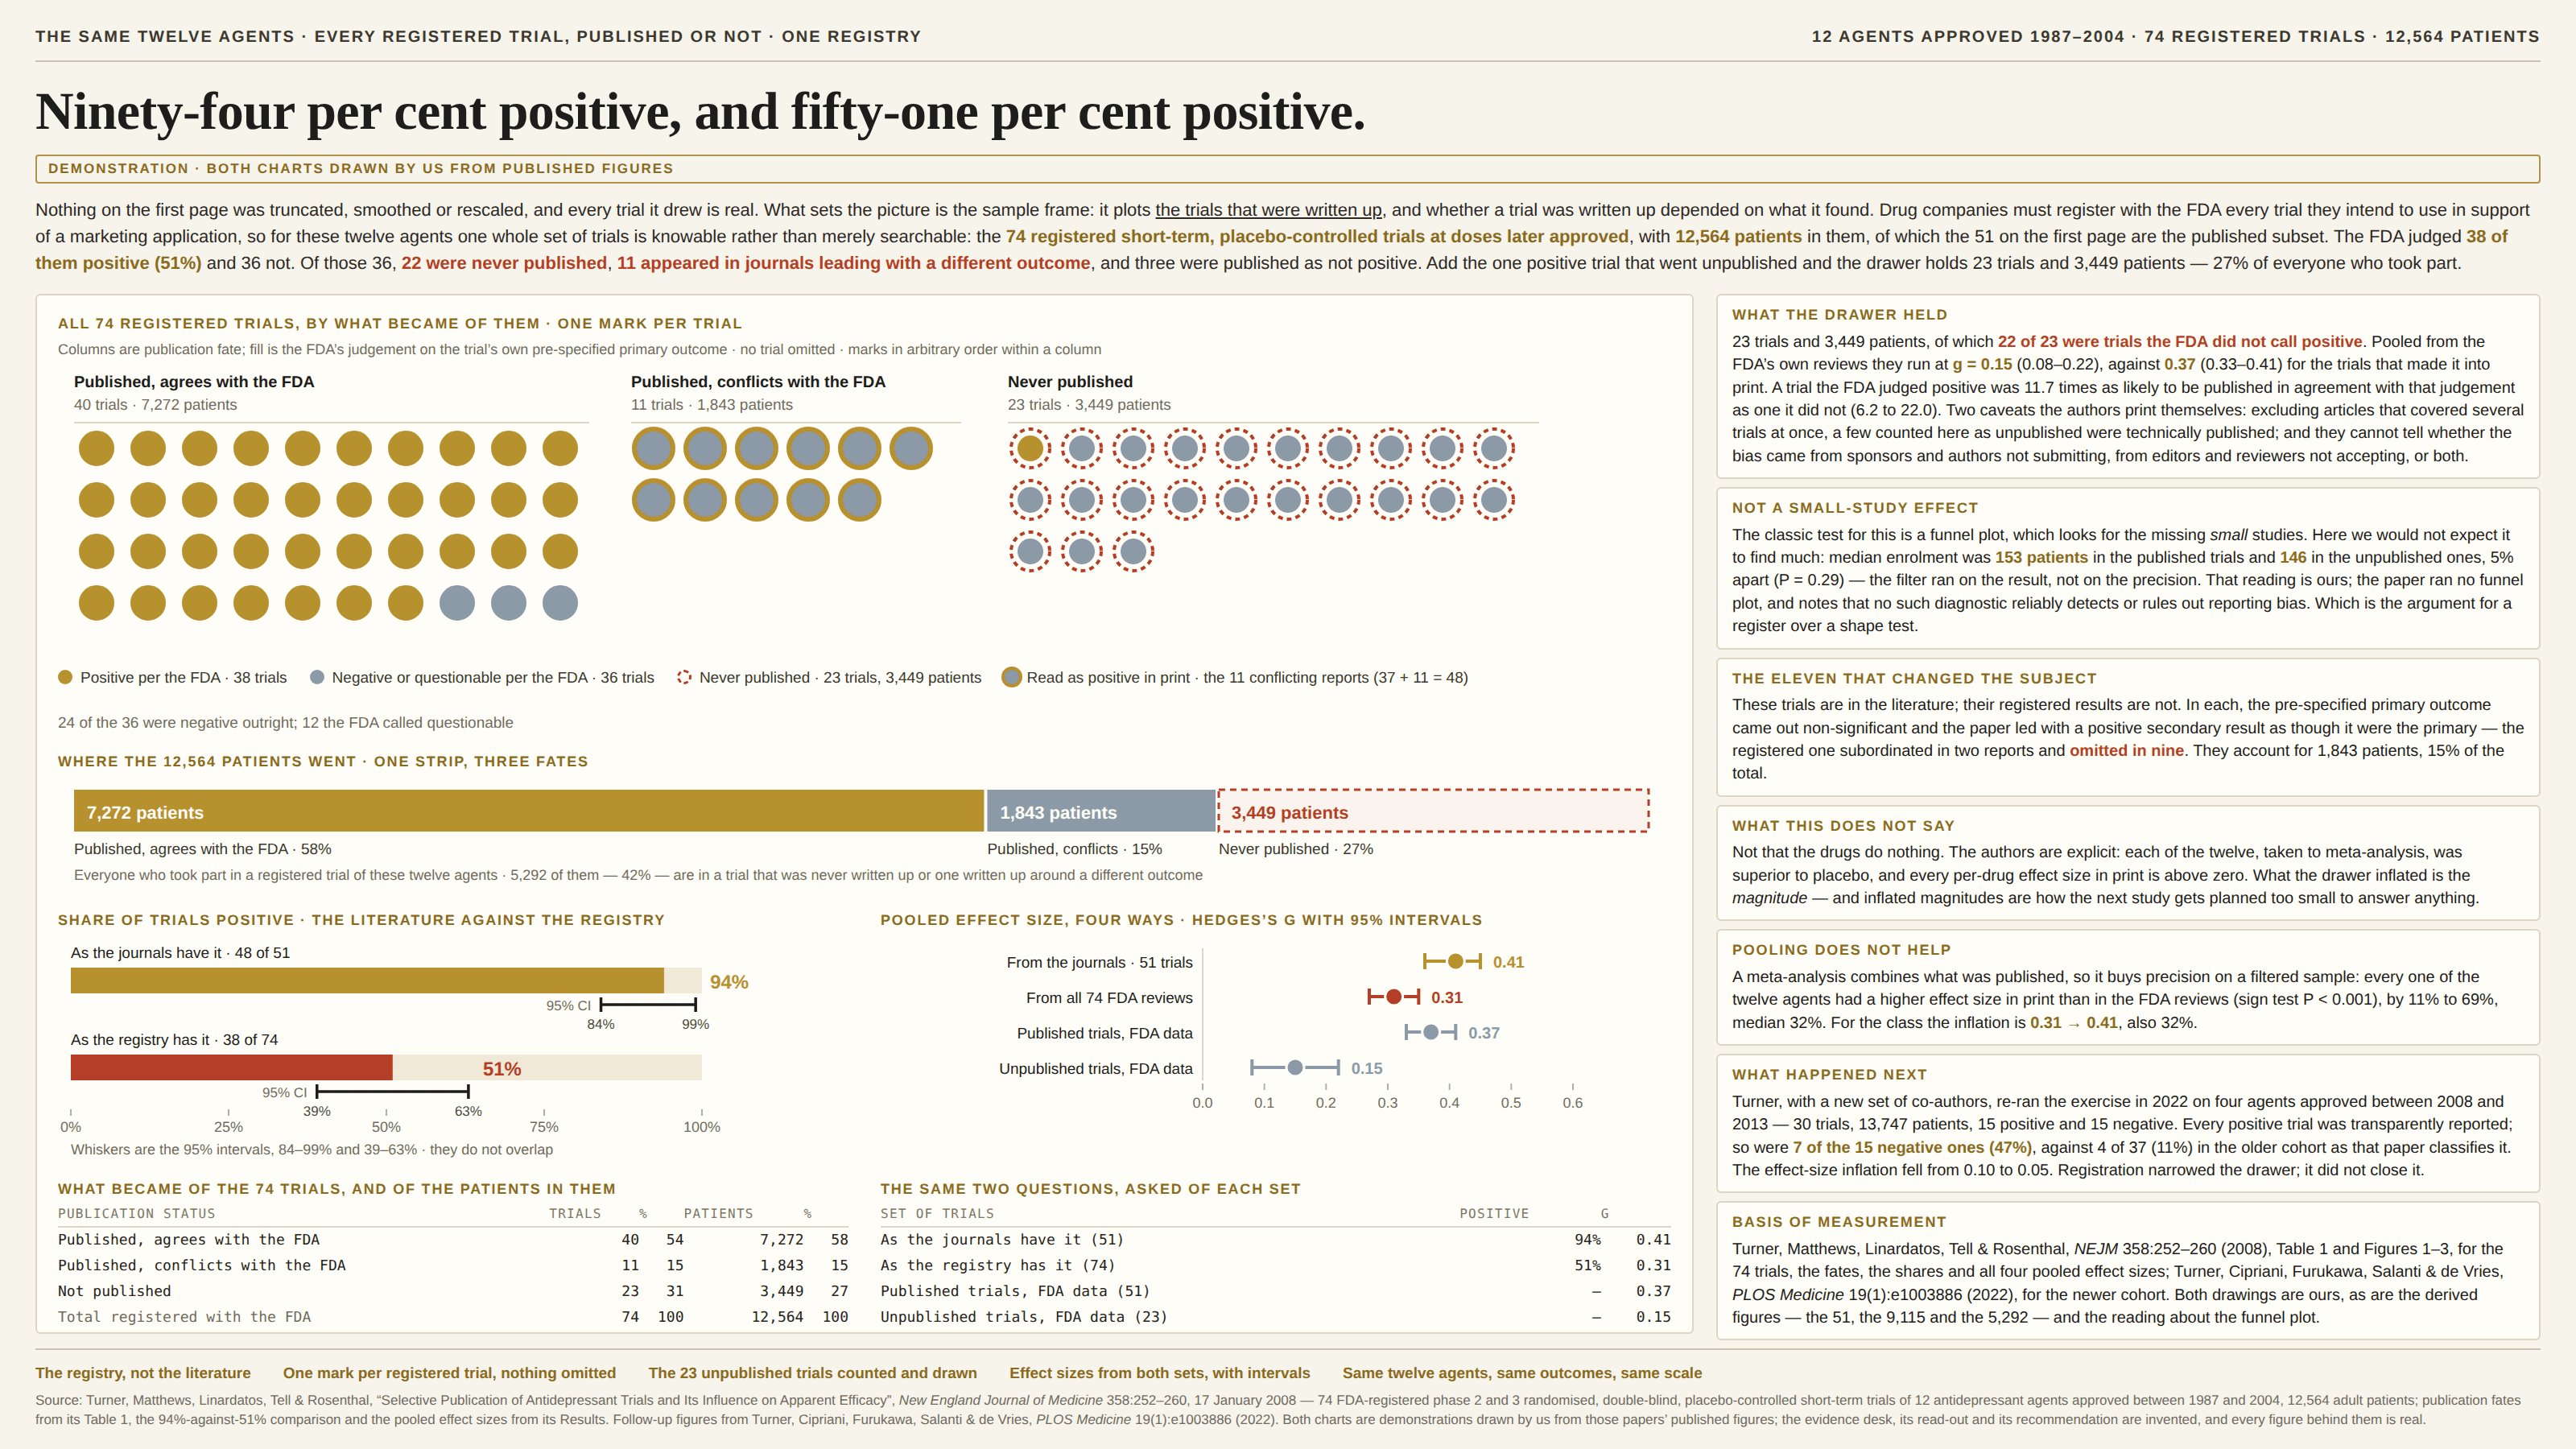
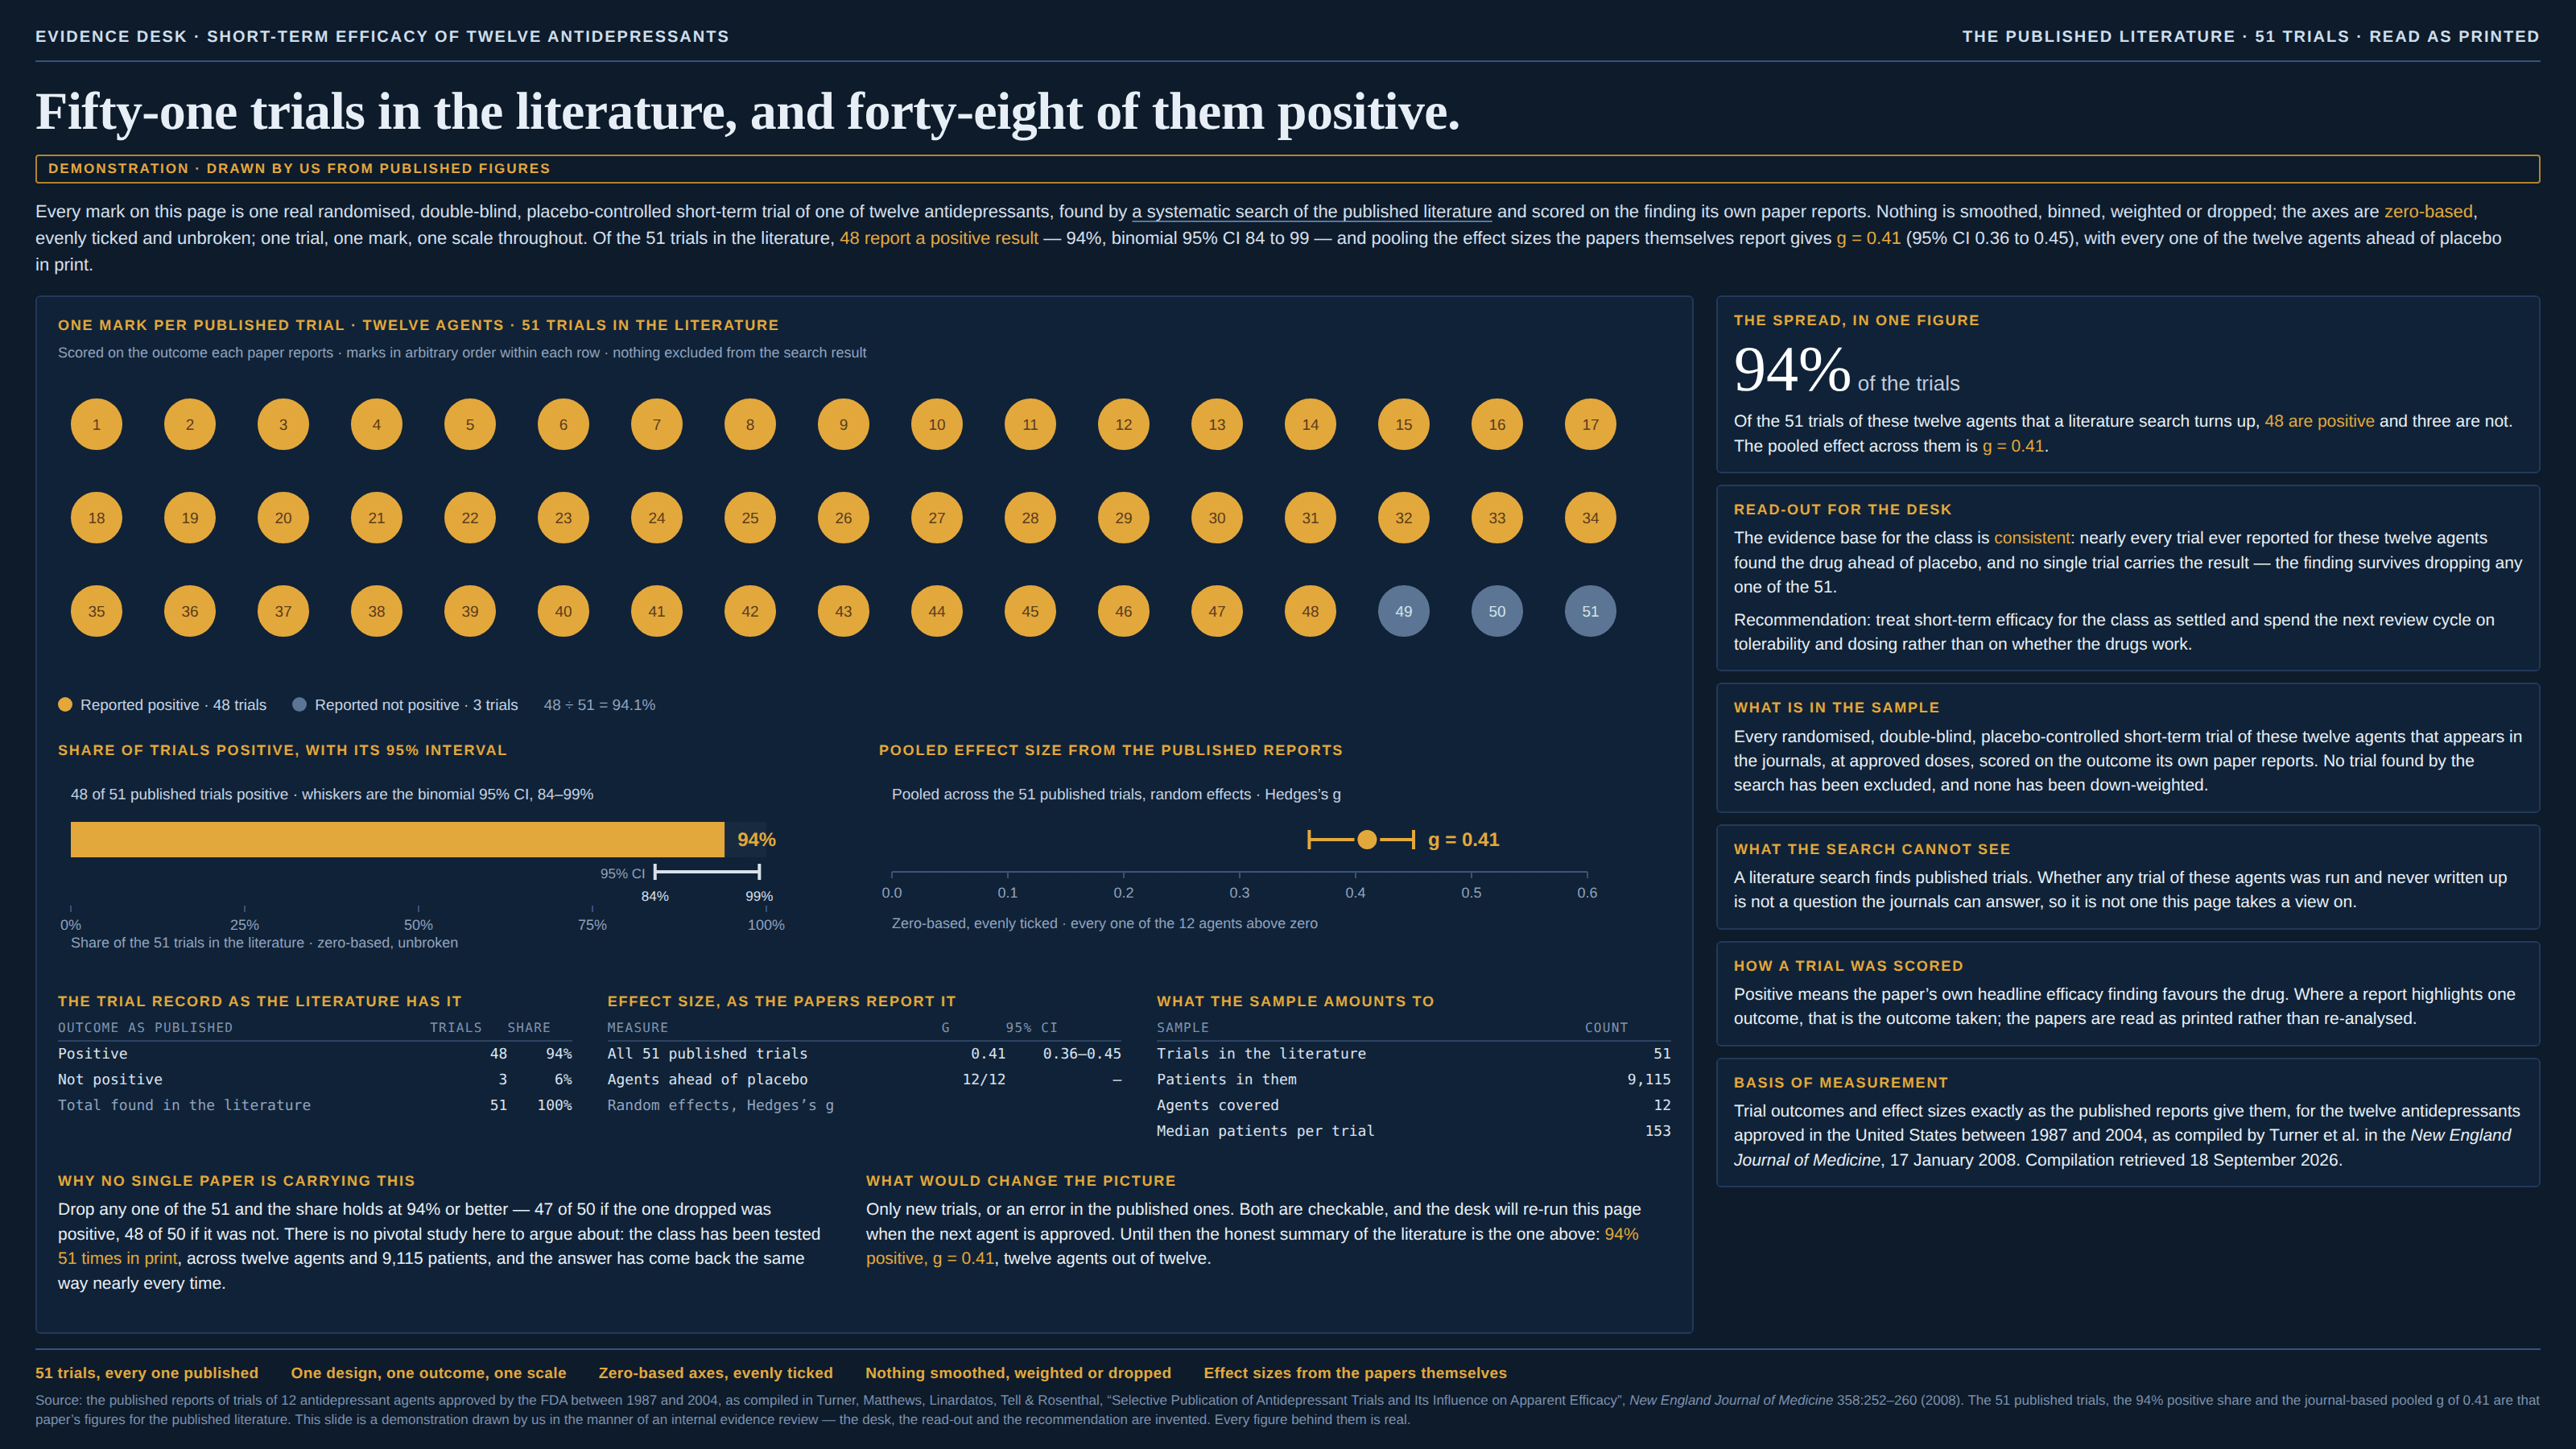
Most of the selection pages in this guide select cases — the planes that came home, the people who felt like replying, the cycles that got as far as a transfer. This one selects findings. The study was run, the analysis was done, the numbers exist; whether they ever enter the record depends on how they came out. That is the whole mechanism, and it is worse than it sounds, because the thing being filtered is the very quantity the chart is measuring. A null is less likely to be written up, less likely to be accepted, and where it is published is likely to lead with whichever outcome did reach significance — which is the same filter running inside a single paper, on one of its own tables. So a literature is not a sample of what was tried. It is a sample weighted by result, and it leans the same way every time: toward the interesting answer. Nothing on the page can give this away. Every study plotted is real, every effect size is correctly computed, the axis starts at zero and the search was exhaustive; the sample frame is the crime, and a sample frame is not a mark on a chart. Pooling makes it worse rather than better, because a meta-analysis is a machine for combining precisely what got published: add studies and the interval tightens around the filtered number, so the picture grows more confident without growing more right. The closest relative in this guide is the reporting threshold, and the difference between them is the useful part. A threshold filters on a characteristic of the unit — a tonnage, a headcount, a turnover — fixed before any data exists, and the rule is published, so a reader who looks can find the line and often an estimate of what sits below it. This filters on the realised result, after the fact, and no rule is written down anywhere: there is no line to look up, no impact assessment to read, and nobody to ask how many studies are missing except a register that may not exist.
How to spot it
- Ask what a row had to do to exist. On a chart of evidence the rows are write-ups rather than attempts, and the two sets differ by exactly whatever the filter took.
- Count the nulls. A field in which nearly every published test comes out positive is either studying something extraordinarily clear-cut or showing you its drawer, and the second is commoner.
- Look for a register, because it is the only thing that can settle it. Trial registries, pre-registrations, regulators’ reviews, ethics approvals, grant records, a team’s own experiment log: registered count minus published count is the size of the drawer, and it is one line to print.
- Read what a paper says its pre-specified primary outcome was, then read what its abstract leads with. Where those differ, the study is in the literature and its registered result is not.
- Do not stop at the funnel plot. It hunts for the missing small studies, so it catches selection on precision; where the filter ran on the result instead, the missing studies are the same size as the published ones and the funnel comes back tidy.
- Ask who had to decide to write it up, and what a null would have cost them. Nobody has to suppress anything for this to happen — a drawer fills by default, from tiredness and the next deadline.
- “We searched PubMed, Embase and Scopus” standing alone as the method. That is a thorough search of the surviving record, which is a different object from the record.
- Effect sizes that shrink as the studies get bigger, or as replications and later trials arrive. A finding that fades with scrutiny was often a finding selected for being large.
- A pooled estimate quoted with a narrow interval and nothing beside it — no funnel, no trim-and-fill, no p-curve or selection model, no count of registered studies. The narrowness is a fact about how many write-ups were found.
The fix
Count the drawer and print the count. Start from a register rather than from a search, because the register is the only place the unwritten studies exist: state how many were registered, how many were published, and the difference, in the caption, the way you print a unit. Where no register covers the question — and for most fields none does — say that in the same breath, since “we cannot see what was not written up” is the most useful sentence available and costs a line. Then test the shape of what you do have, and use more than one test: a funnel plot catches selection on precision, a p-curve or a selection model catches selection on significance, and the case where they disagree is informative rather than awkward. Mark the studies whose reported outcome is not their registered one, because that half of the mechanism is the recoverable half: the registered result usually still exists, in a registry entry or a regulator’s review, and putting it back is arithmetic rather than judgement. Resist the pooled number as the headline. Give the reader the spread of studies with the drawer’s size beside it, and quote the estimate with a range across plausible corrections rather than one interval that assumes the record is complete. Say what the inflation costs, because it is not only a wrong headline: the published effect is what the next study gets powered off, so an inflated one buys a sample size too small to answer the question, and the underpowered result then joins the same literature. Upstream, the cures are known and boring: prospective registration, mandatory results reporting, registered reports where the journal accepts the design before it sees the finding. They work — where trial registration has bitten, the drawer has visibly narrowed — and they narrow rather than close it. And keep two sentences apart, in your reading and in your writing, because they are not the same claim and only one of them is usually supported: “the published studies show” is a statement about a literature, and “the studies show” is a statement about the world. The same discipline applies to your own shop, which has a drawer too — the A/B tests nobody slid into the deck, the models that did not ship, the pilots that quietly ended. Keep a log of every experiment started, and report from the log rather than from the wins.
In the gallery