All techniques
Framing & context
The establishment label
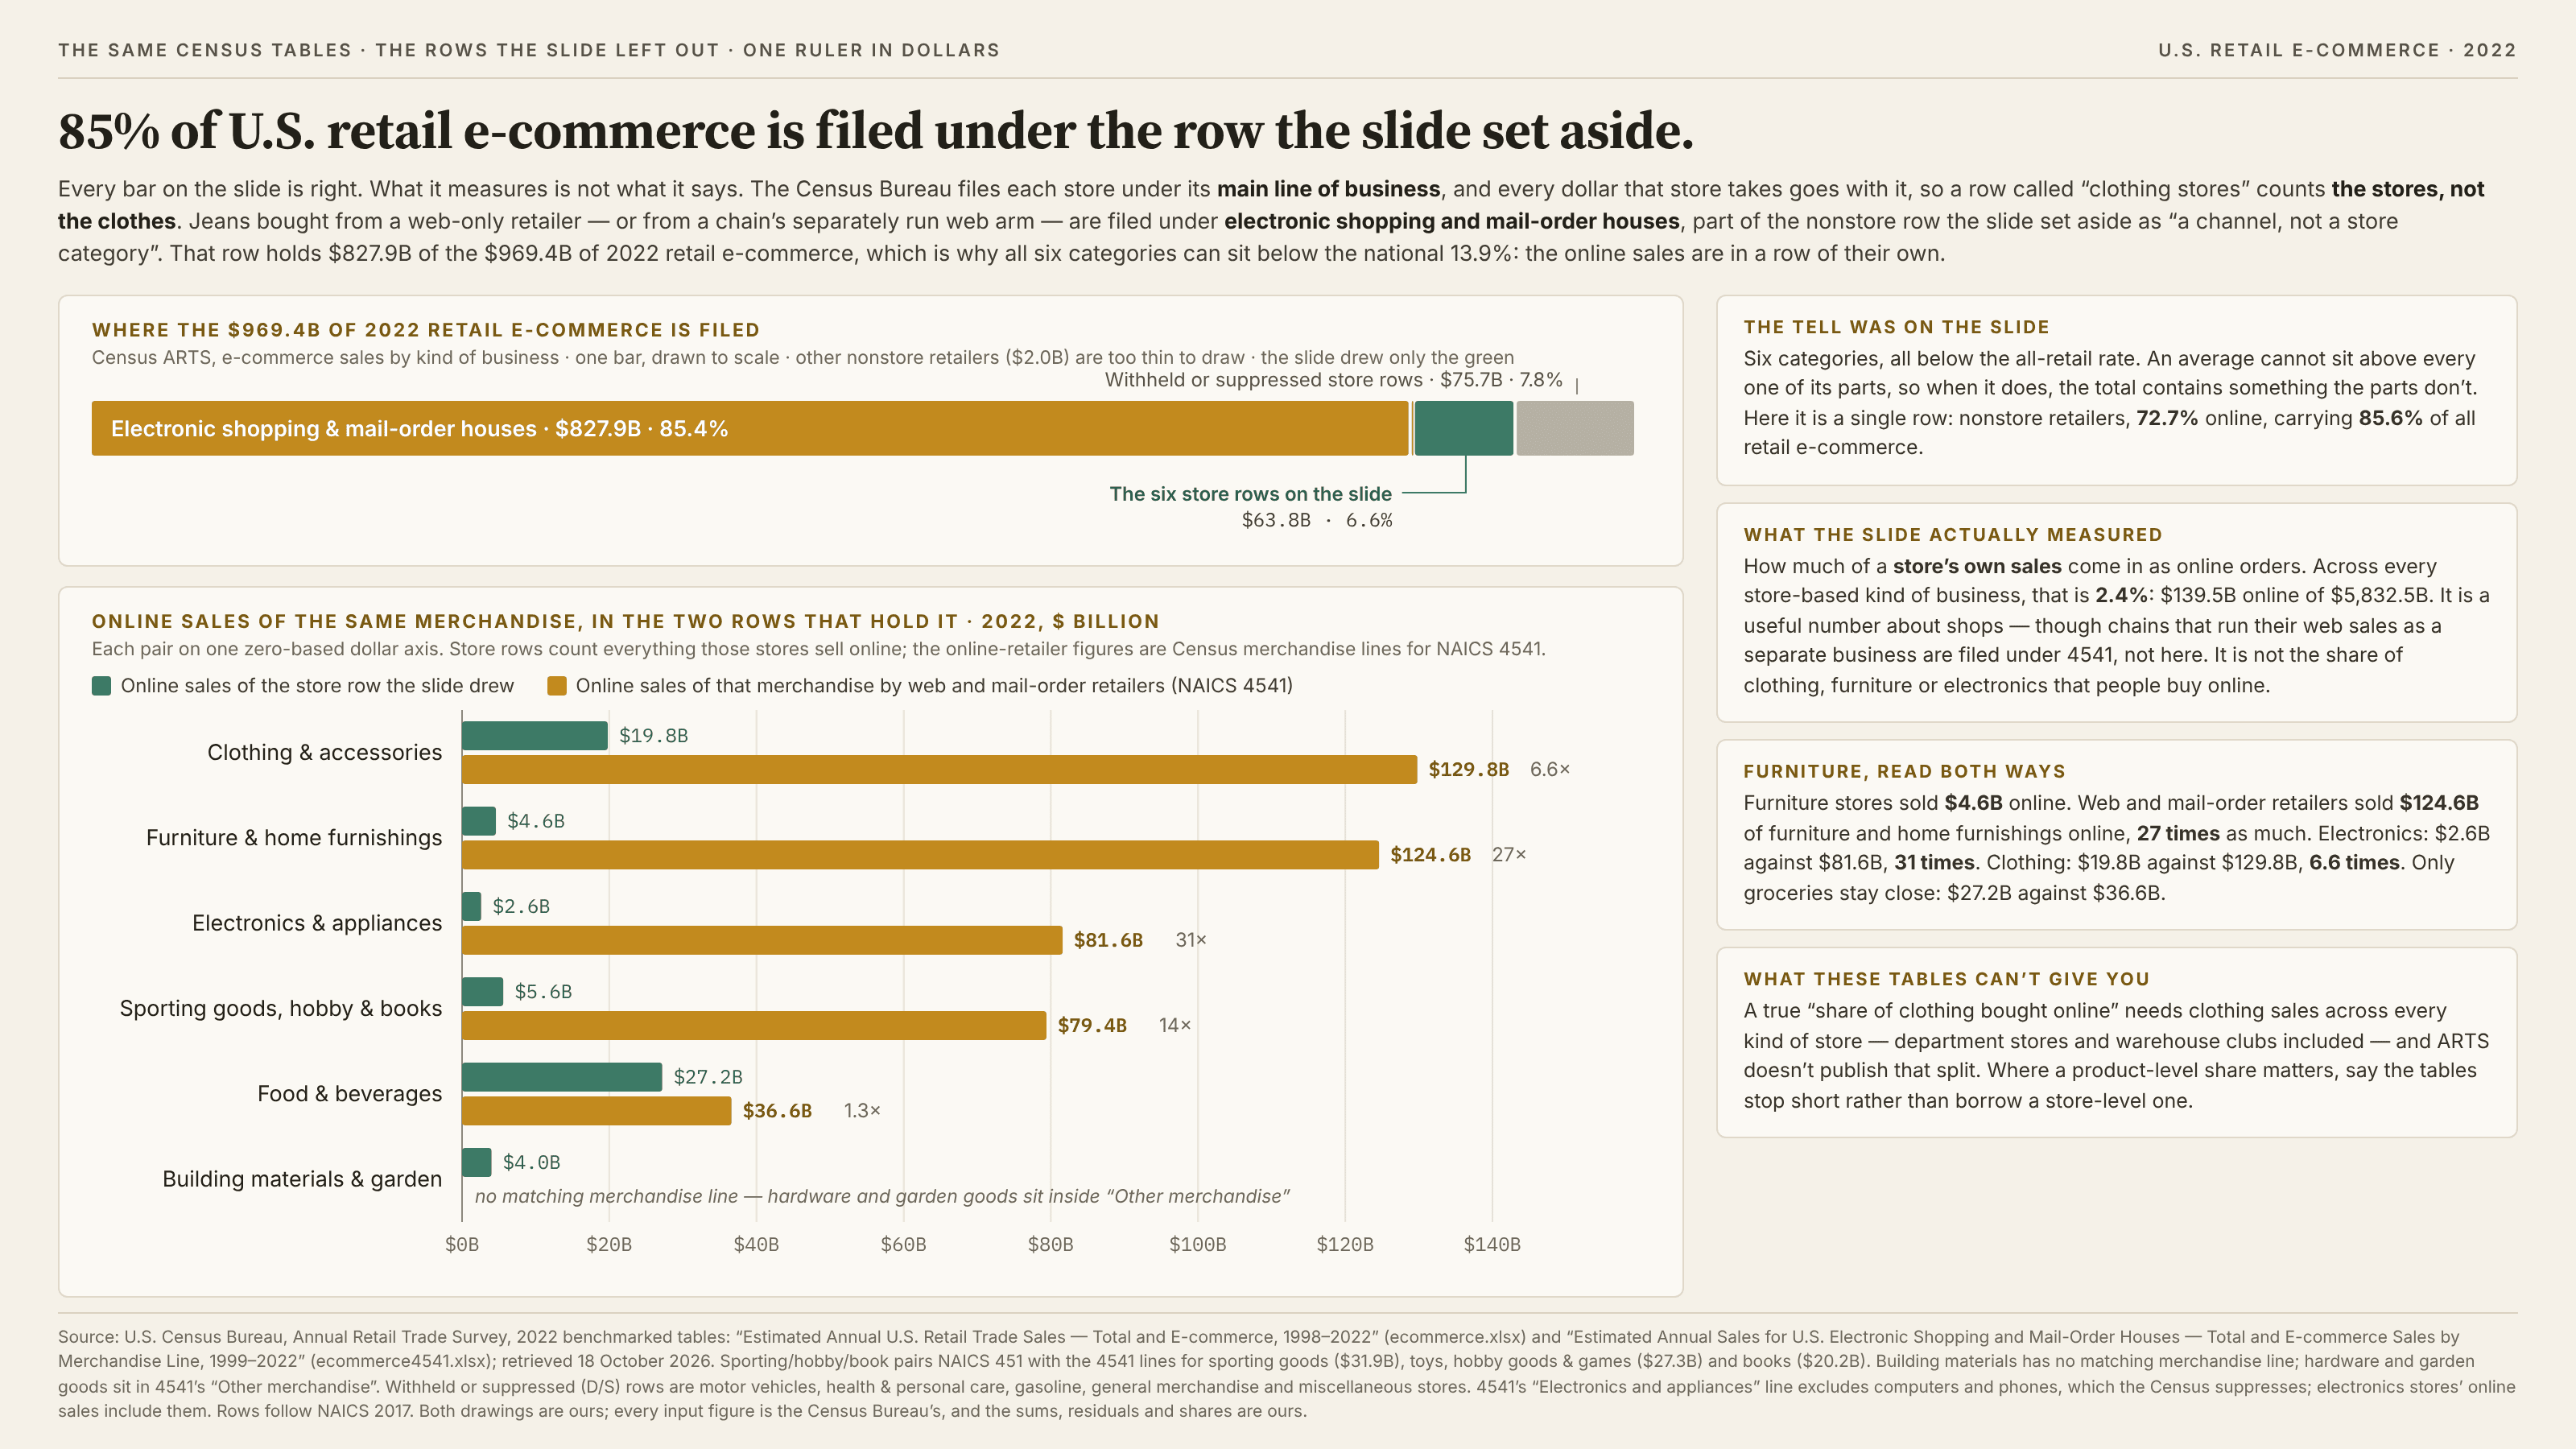
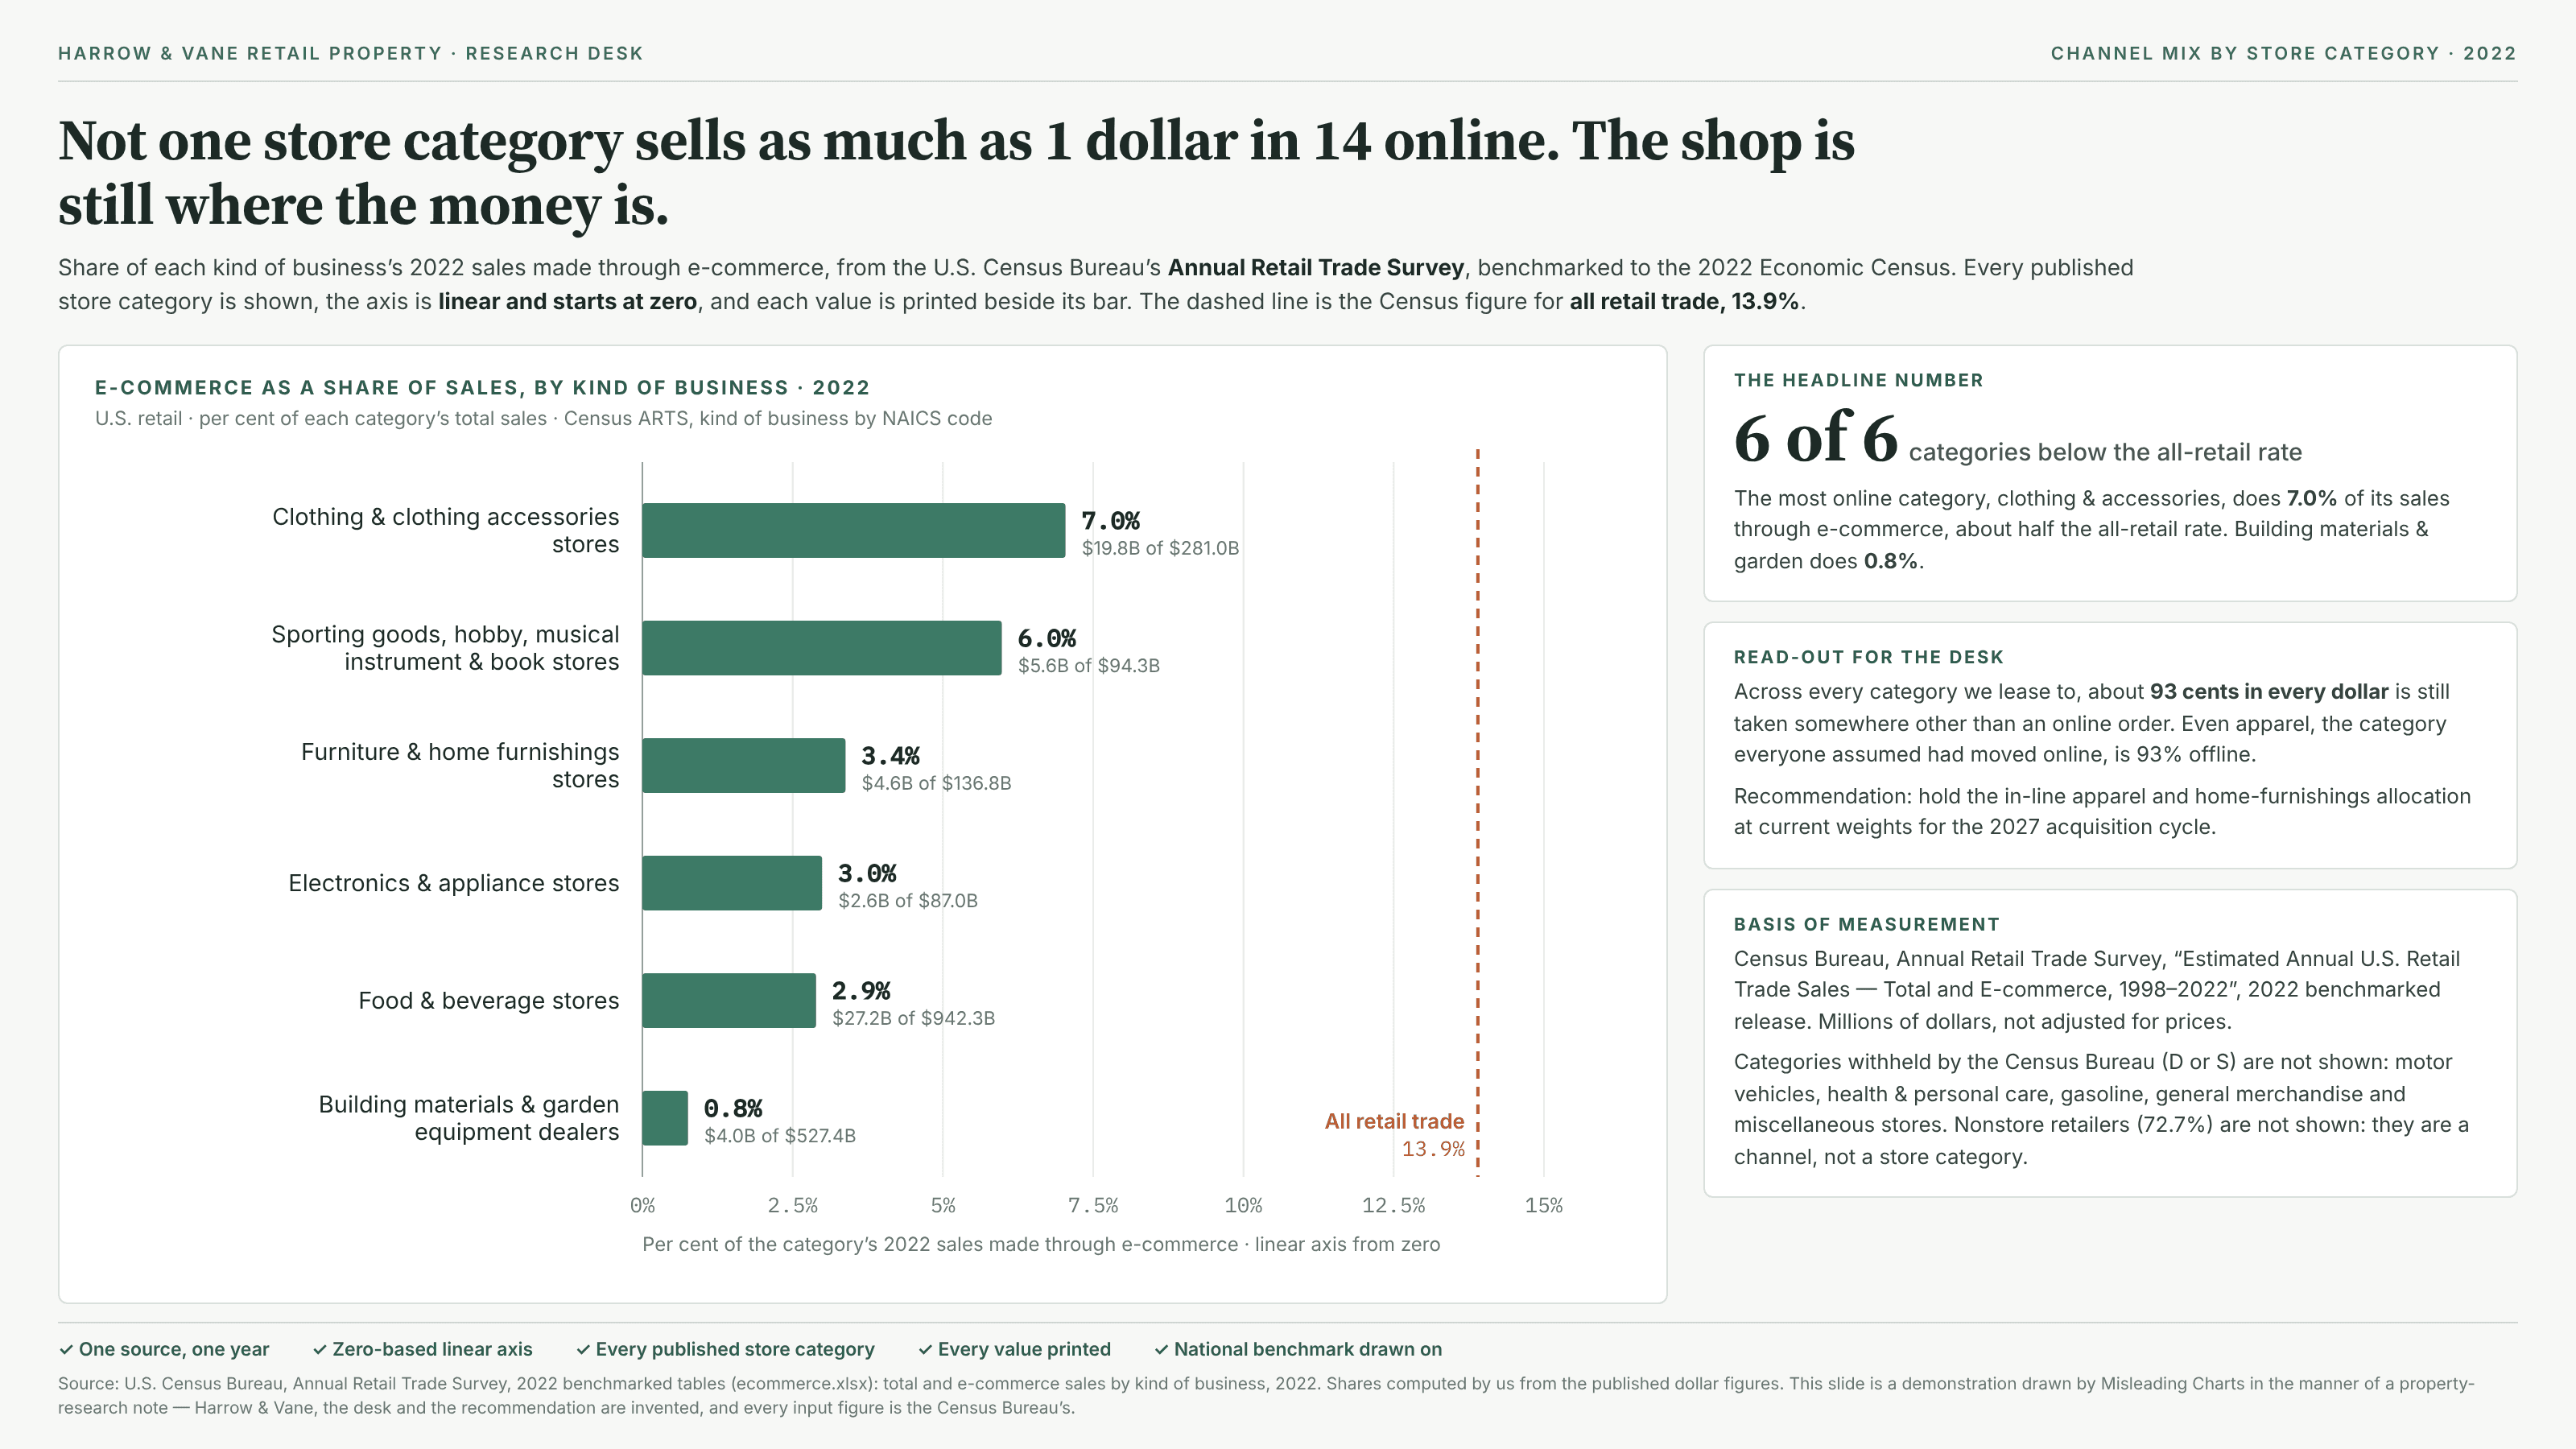
A row called “clothing stores” counts the stores, not the clothes.
a.k.a. kind of business · industry versus product · NAICS category · SIC code · primary activity · establishment classification · the store-type table · sector versus merchandise · filed under the seller
Official business statistics are mostly counted by establishment: each shop, plant or office is given one industry code for its main line of business, and everything it sells, employs or emits is filed under that code. So the row headings in an industry table name kinds of seller, and they read exactly like kinds of product. “Clothing stores” is every sale a clothing store makes, the homeware included, and none of the clothing sold by a department store, a supermarket or a website. A chart that relabels those rows as categories — clothing, furniture, electronics — is answering a question about who did the selling while looking like an answer about what was bought, and the two come apart wherever one kind of seller handles a lot of everyone else’s goods. Online retail is the textbook case. Under NAICS 2017 a web-only retailer is coded as its own industry, so its jeans and sofas never reach the clothing or furniture rows at all, and a table of store types can show every category selling a small share online while the country buys a large share of the same goods that way. Nothing in the figures is wrong; the mistake is in the heading the chart puts over them. (The 2022 revision of NAICS folded most online retailers back into the product-named store industries, which moves the problem rather than ending it: any series that spans the change is now a redefined measure too.)
How to spot it
- Read the row labels in the source, not on the chart. “Stores”, “dealers”, “manufacturing”, “services”, a NAICS or SIC code beside each row: the table is sorted by seller, whatever the chart calls it.
- Look for a row left off as “not a category” — nonstore retailers, wholesalers, “other services”, holding companies. A row that is defined by how it sells rather than what it sells is usually where the other rows’ goods went.
- Check every bar against the total. When all the categories sit below the all-industry figure, the total contains something the categories don’t, and an omitted row is the first suspect.
- Ask where a familiar purchase would be filed. A phone bought from a supermarket, a sofa from a website, a prescription by post: if the obvious example lands outside the row that bears its name, the chart is reading seller as product.
- Watch for product-sounding headlines on industry data — “X% of clothing is bought online”, “the steel industry’s share of emissions”. Those need a product-level table, and the agency will say whether it has one.
The fix
Say which question the table answers, and put the word on the chart: “clothing stores”, not “clothing”. If the question really is about sellers — how much of a store chain’s own business goes through its website — the industry table is the right instrument, and it should be read with every row on it, the awkward ones included. If the question is about products, find the table that is classified by product: statistical agencies publish sales by merchandise line, output by product code and spending by item, and the numbers often look nothing like the industry rows. Where only part of a product split exists, show both rows that hold the goods side by side on one axis and say what is still missing, rather than lending a seller-level share to a product-level claim.
In the gallery