All techniques
Framing & context
The diluted concentration
Add a bucket of water and the soup gets weaker. The salt is all still there.
a.k.a. dilution · per litre · concentration versus load · flow normalisation · flow normalization · rain dilution · the storm dip · creatinine correction · specific-gravity correction · haemodilution
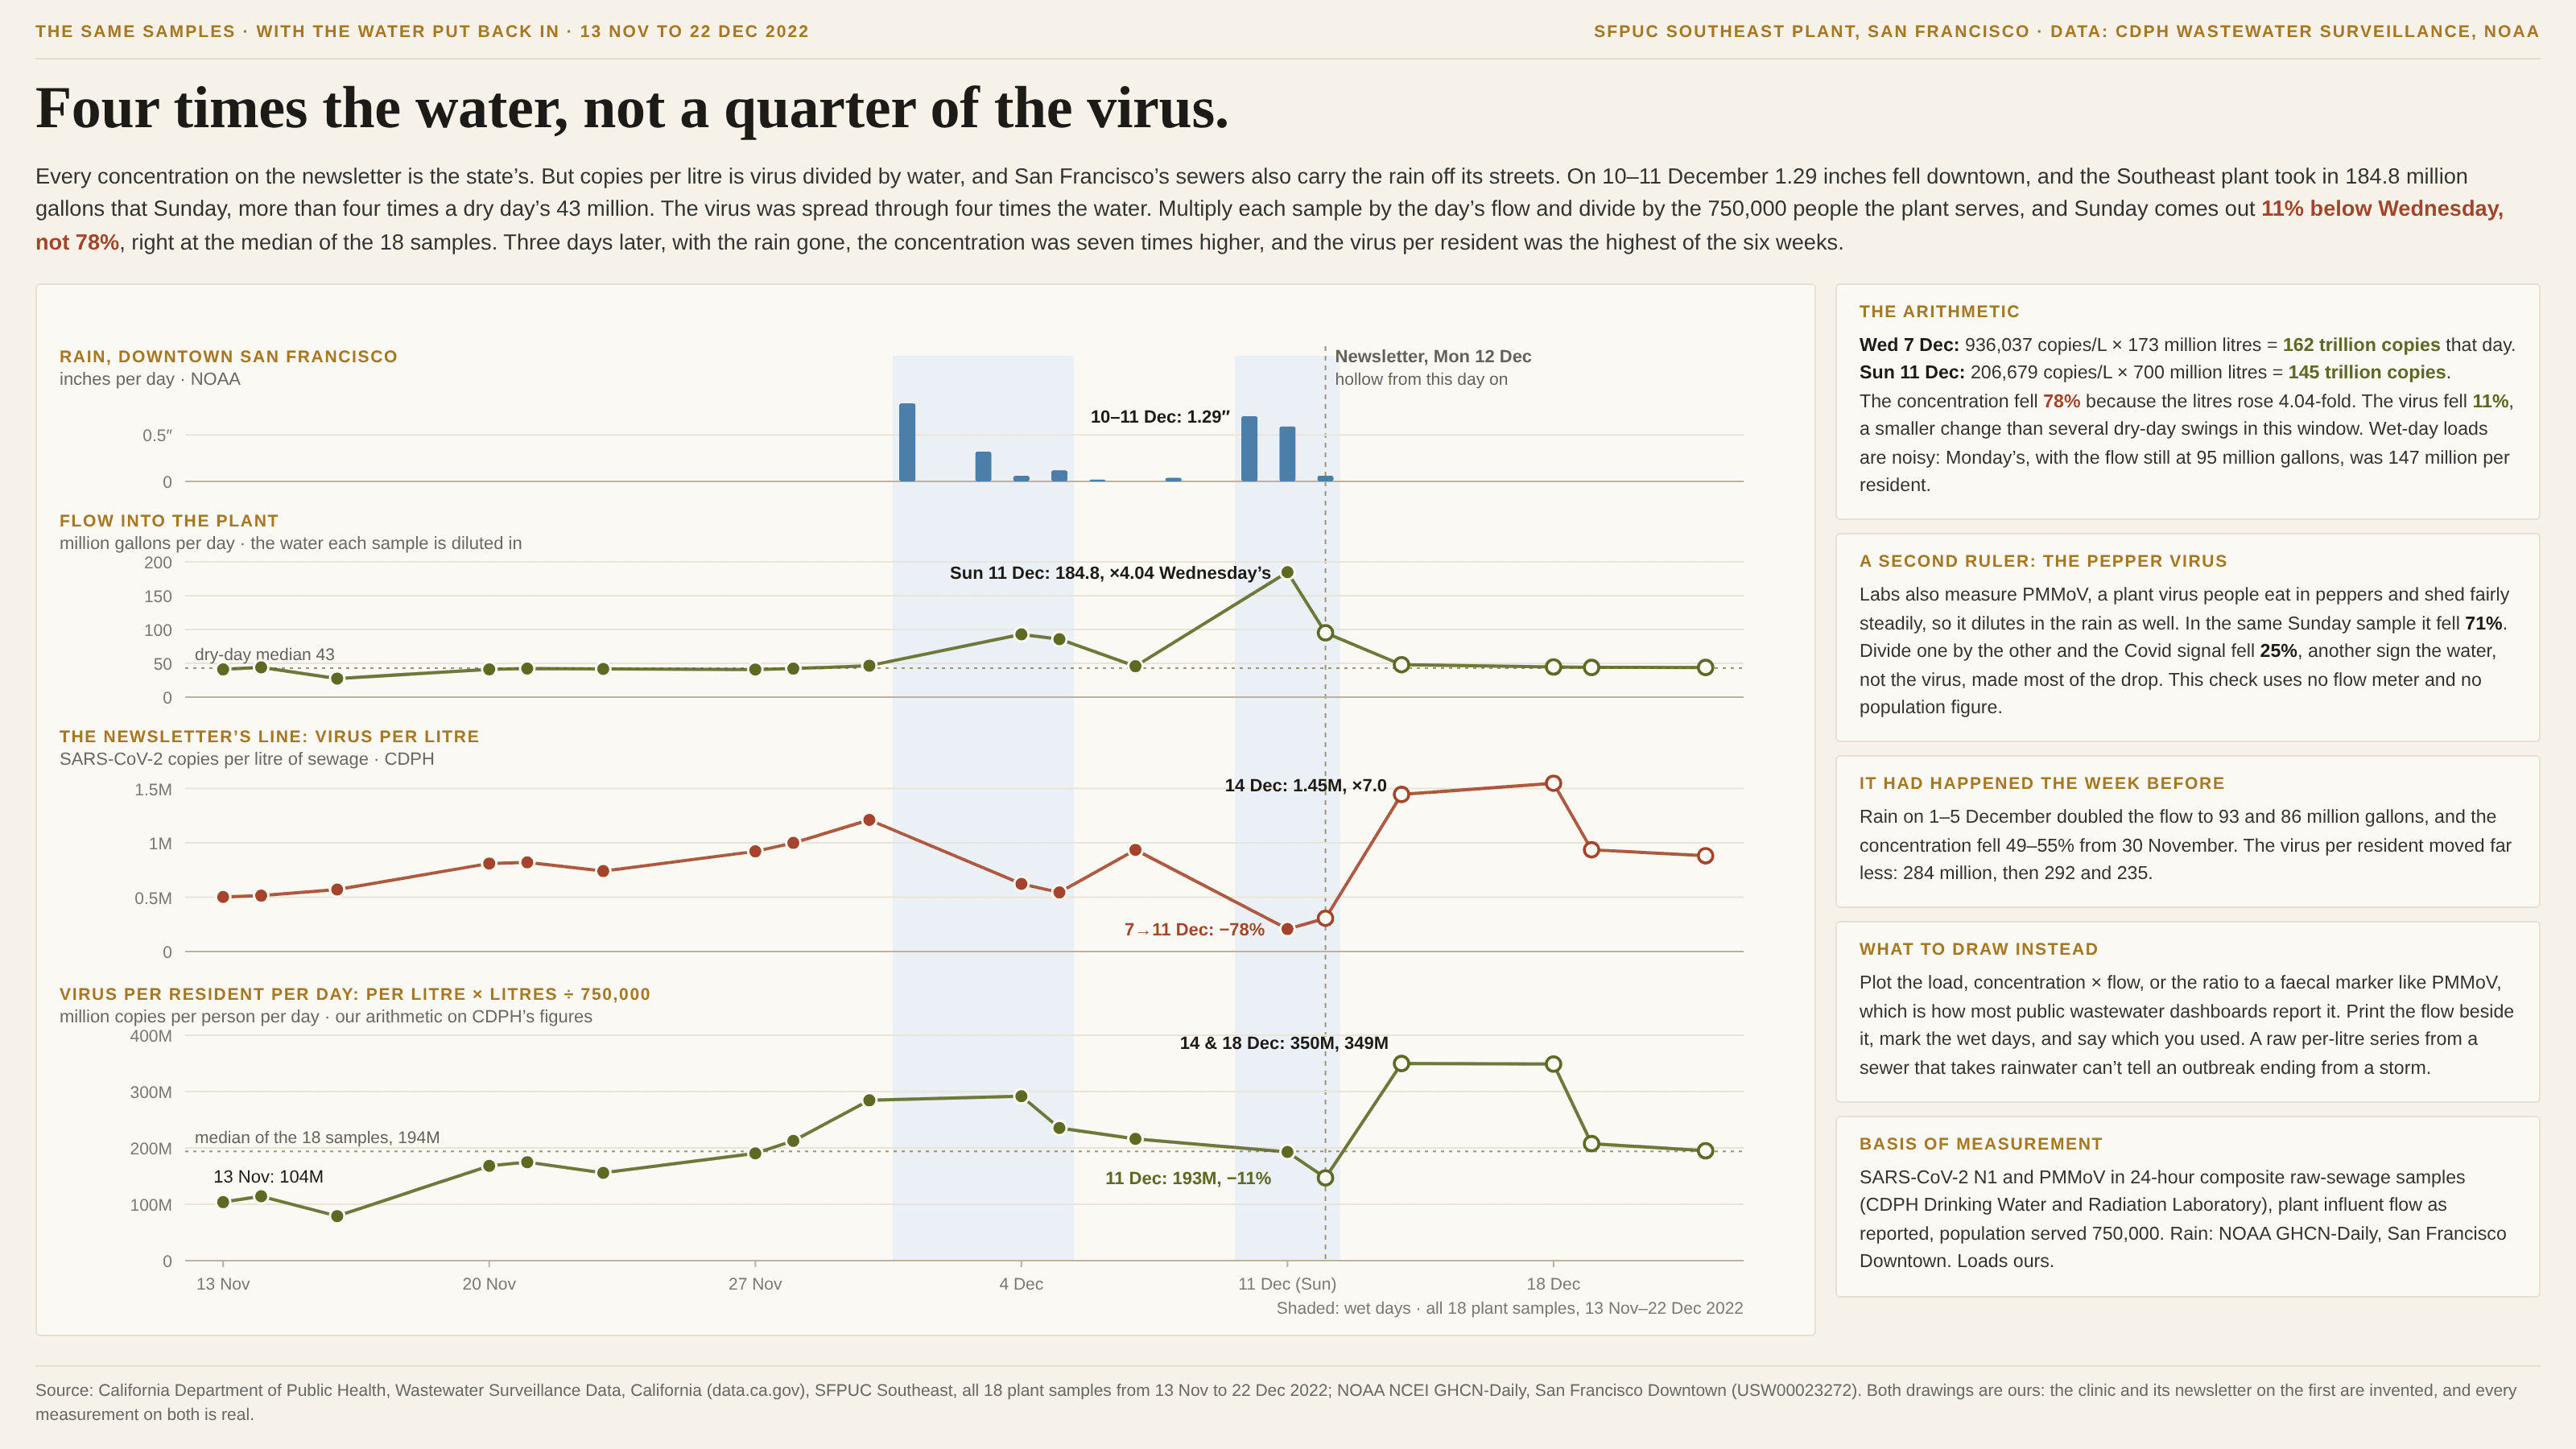
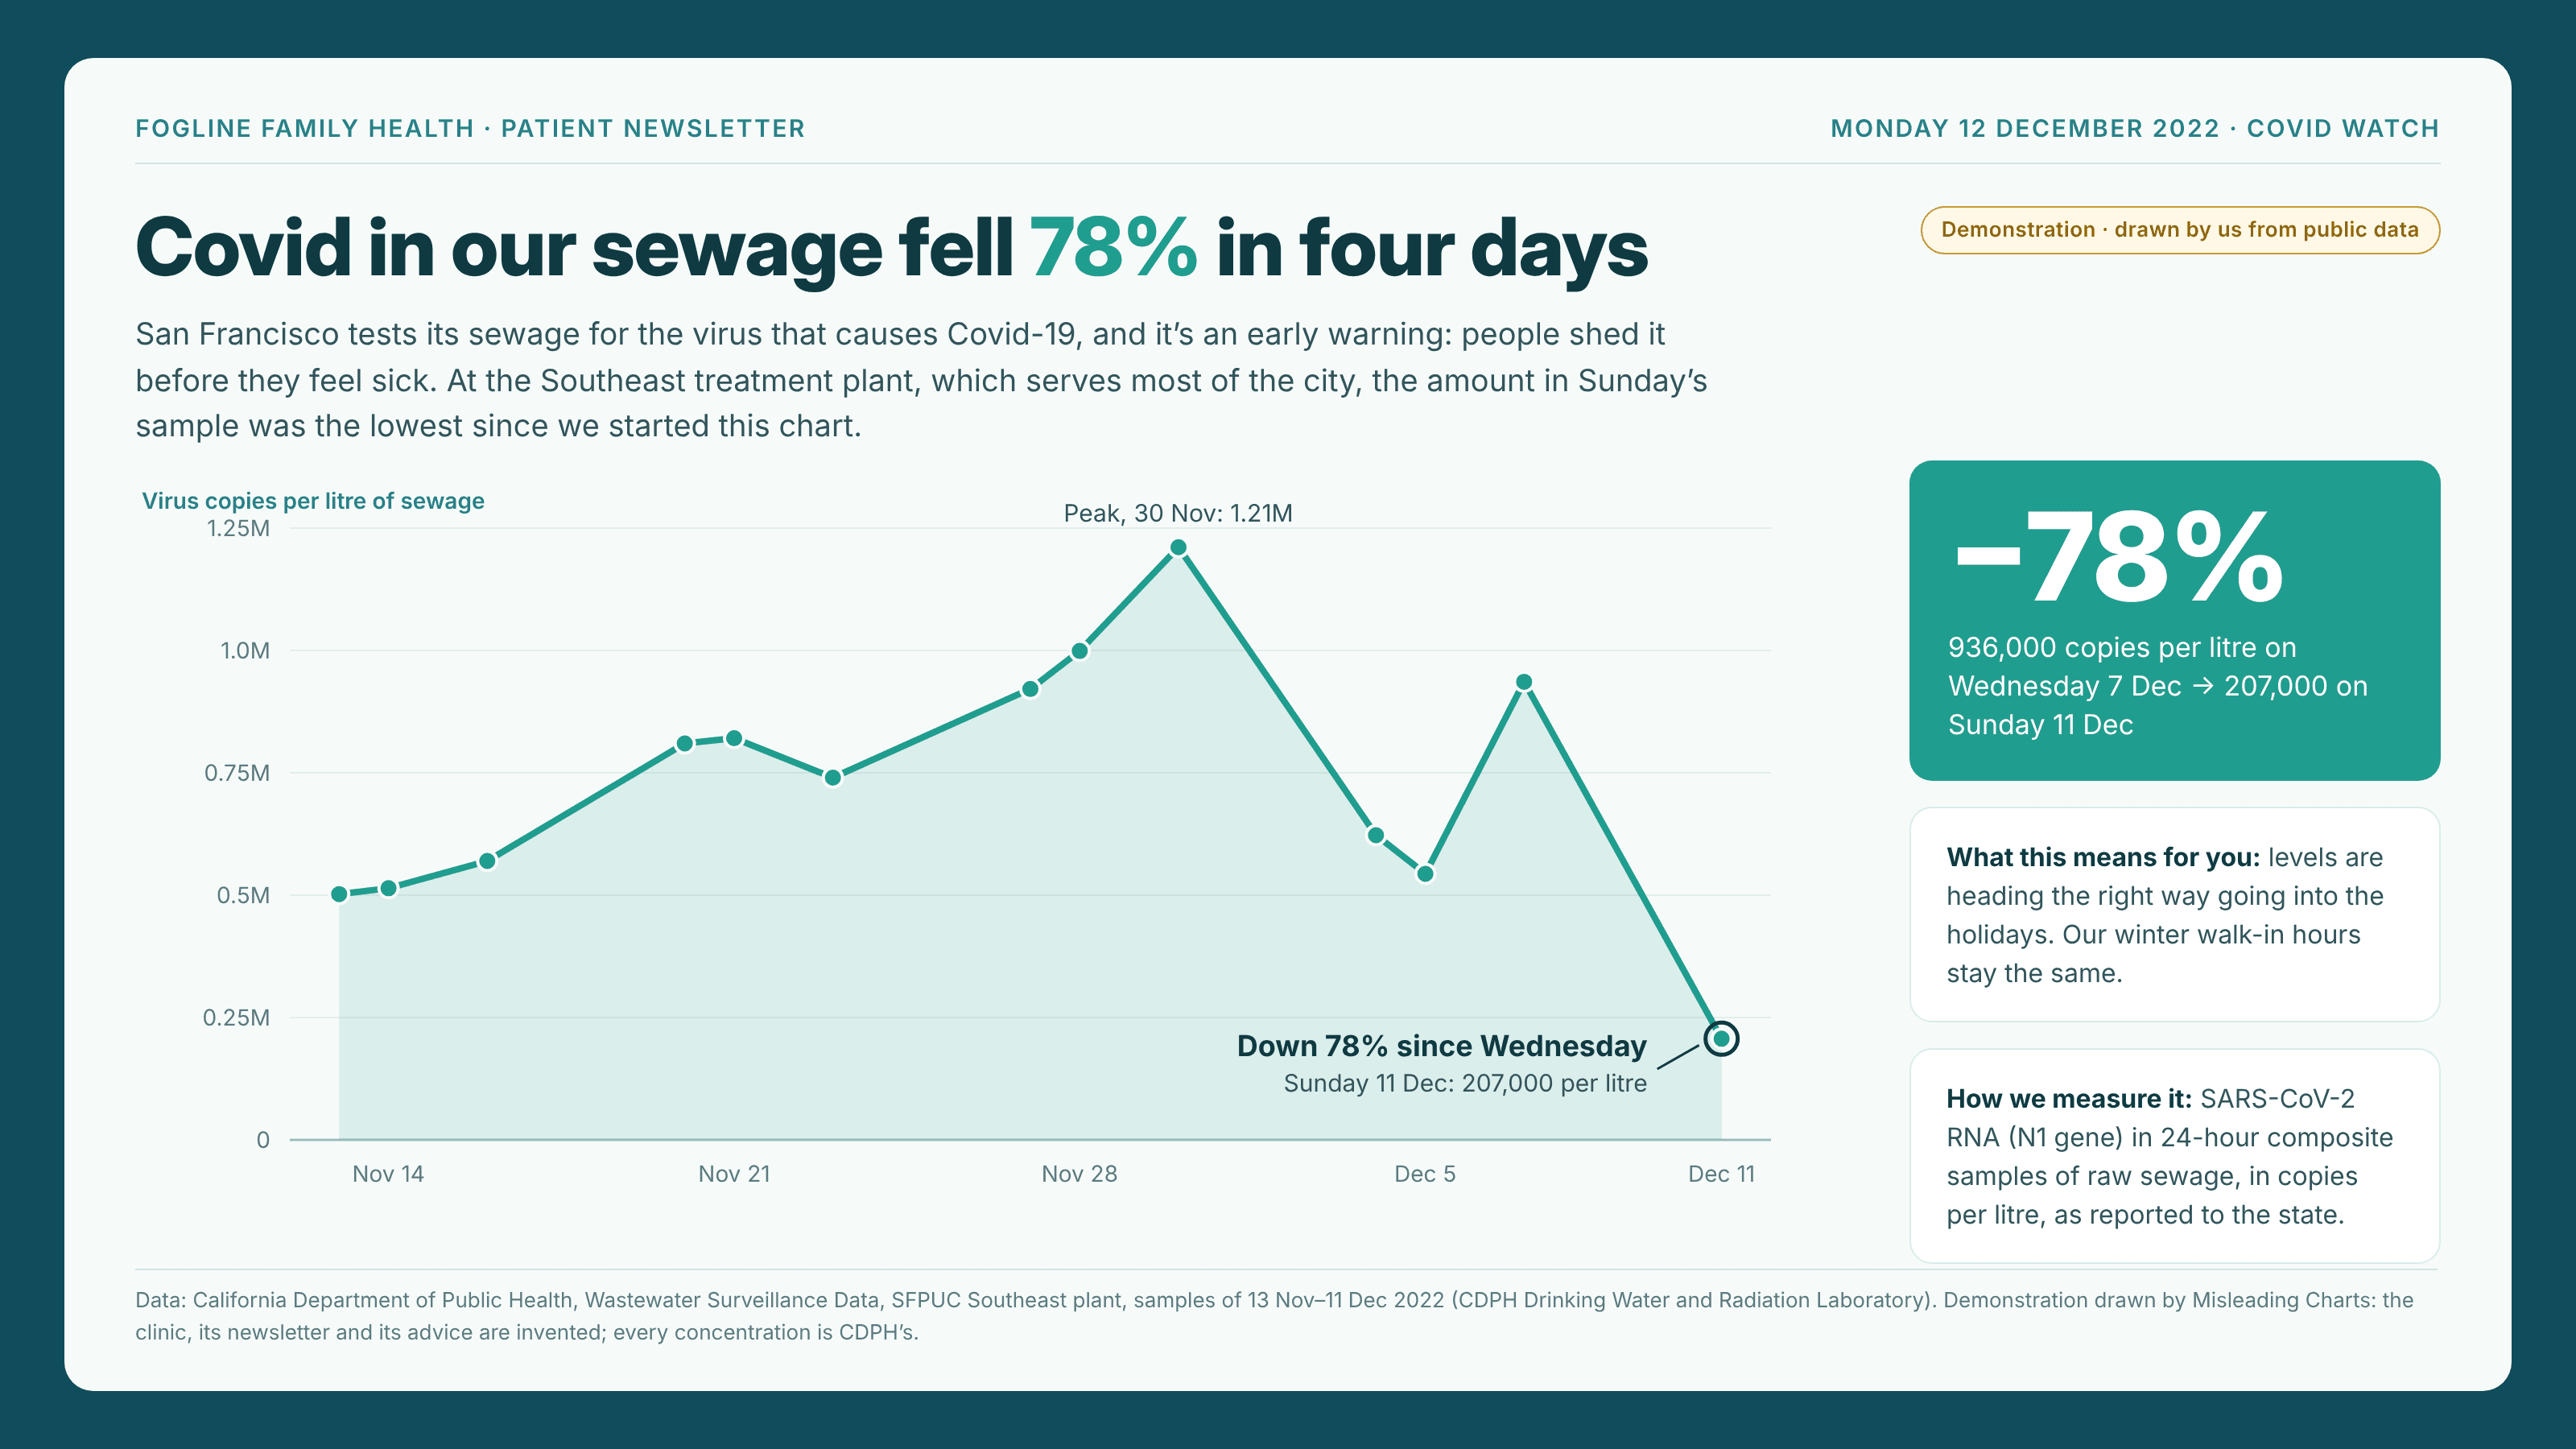
A concentration is an amount divided by a volume: copies per litre, milligrams per litre, parts per million. It reads like a count of the thing itself, but it moves whenever the volume moves, and the volume often moves for reasons that have nothing to do with the thing. Rain runs into a combined sewer and the virus per litre drops, with the same number of people shedding it. A river in flood carries a treatment works’ steady discharge in more water, so its reading falls even though the outflow didn’t. A patient who drank a lot of water gives a dilute urine sample, and a hormone or drug in it reads low. The arithmetic is correct and the lab work is correct. The chart answers “how strong is the mixture?” while the reader is asking “how much is there?”, and the gap between the two is whatever the water did that day. It is hard to catch because the water never appears on the chart. The axis is labelled “per litre”, the line falls, and nothing marks the day the denominator quadrupled. It runs both ways, too: when the extra water drains away, the concentration jumps back, and that rebound reads as a surge. Keep it apart from its neighbours. The missing denominator is a raw count that needs dividing by something; here the division has already happened, by a volume that swings. The rate at the wrong grain picks a unit too fine for the question and needs compounding; here the unit is the right size, but a litre holds a different share of the population’s output from one day to the next.
How to spot it
- A unit with “per litre”, “per gallon”, “per gram” or “ppm” in it. Ask what fills the denominator and whether it can change from one sample to the next.
- A sudden drop that lines up with rain, snowmelt, a flood, a holiday when industry shuts, or anything else that changes the volume. Look up the flow or the weather for the day of the dip.
- A fall followed a few days later by an equally sudden recovery. Real declines rarely reverse in a single sample; dilution comes and goes with the water.
- Ask whether the source publishes a flow, volume or reference measurement next to the concentration. Wastewater labs record plant flow and a faecal marker such as PMMoV; urine labs report creatinine; river gauges report discharge. If it exists and the chart left it out, put it back.
- Check whether two series measured in the same sample both dropped. When a marker that should be steady falls by the same proportion as the thing of interest, the water did it.
The fix
Report the load rather than the concentration: multiply by the volume to get the amount, and divide by the population or the area that produced it if places of different size are being compared. Where the volume isn’t measured well, divide by something that rides in the same water and should be steady, such as a faecal marker in sewage, creatinine in urine, or a conservative tracer in a river, and say which you used. Draw the flow or the rainfall beside the series on its own axis, so the reader can see the wet days for themselves, and never in a second scale on the same panel. And when only a concentration is available, say so on the chart, and treat any single wet-day reading as uninformative rather than as news.
In the gallery