All techniques
Cherry-picking
The culled denominator
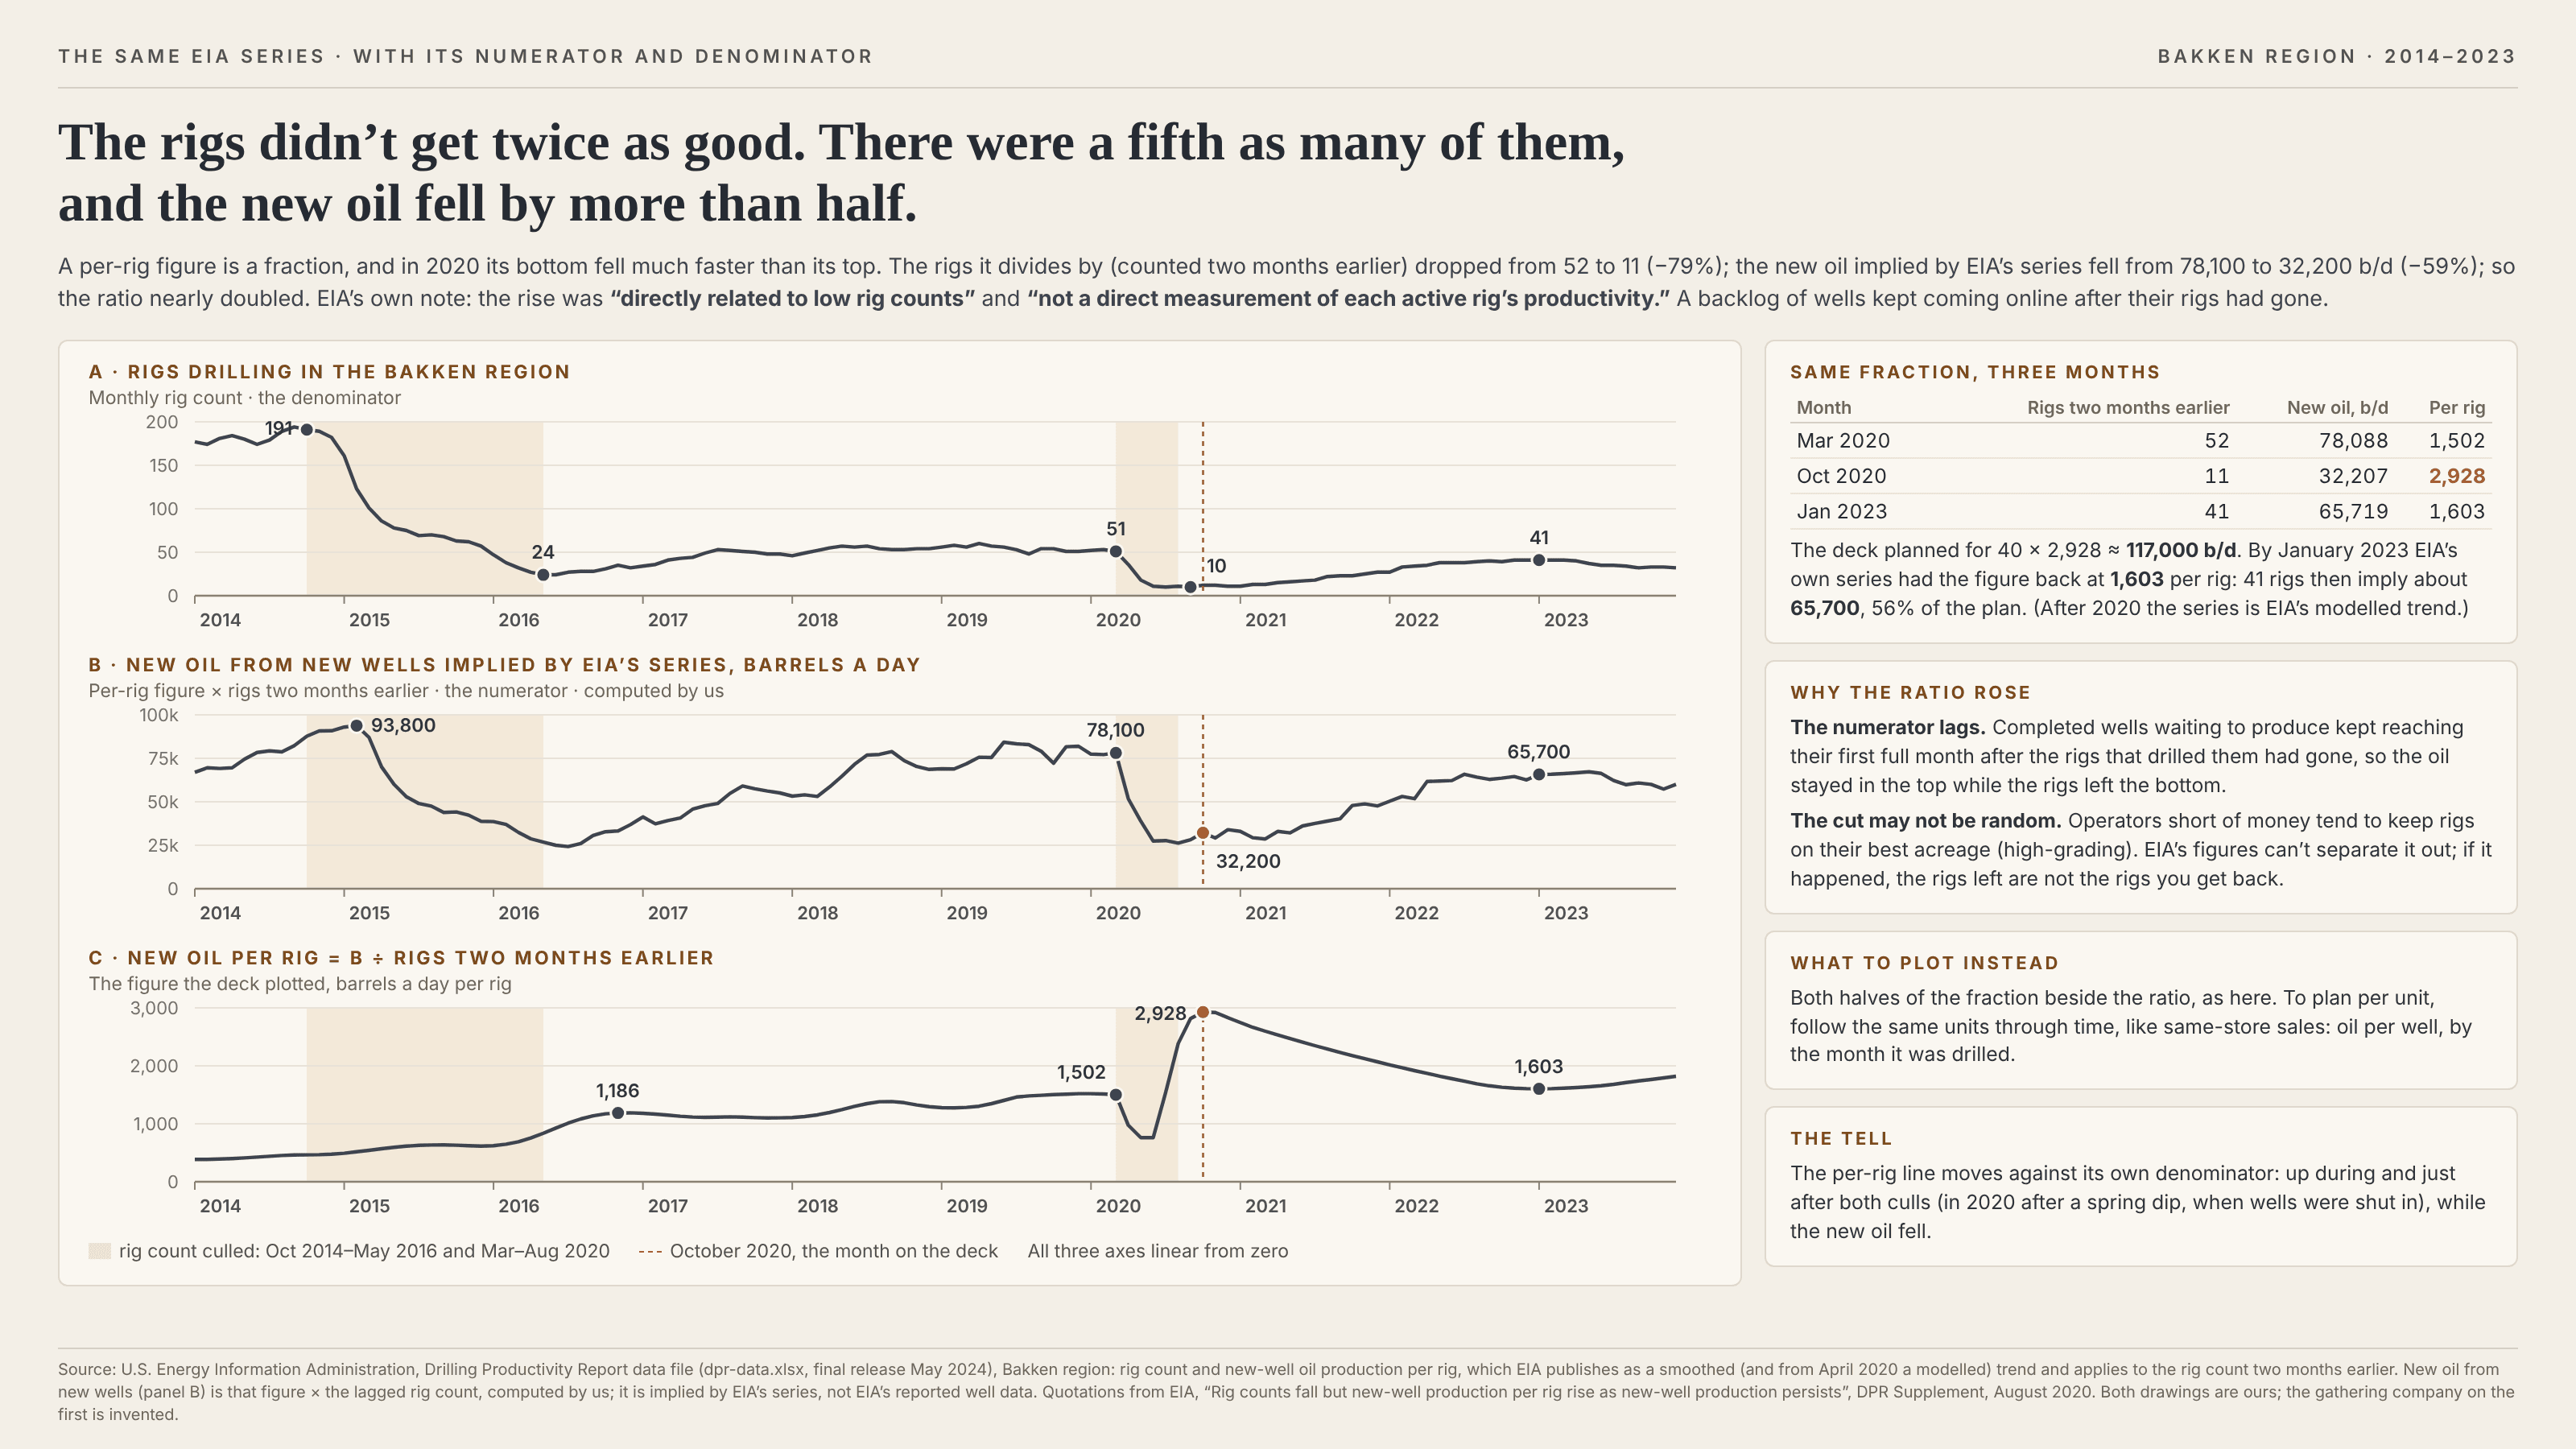
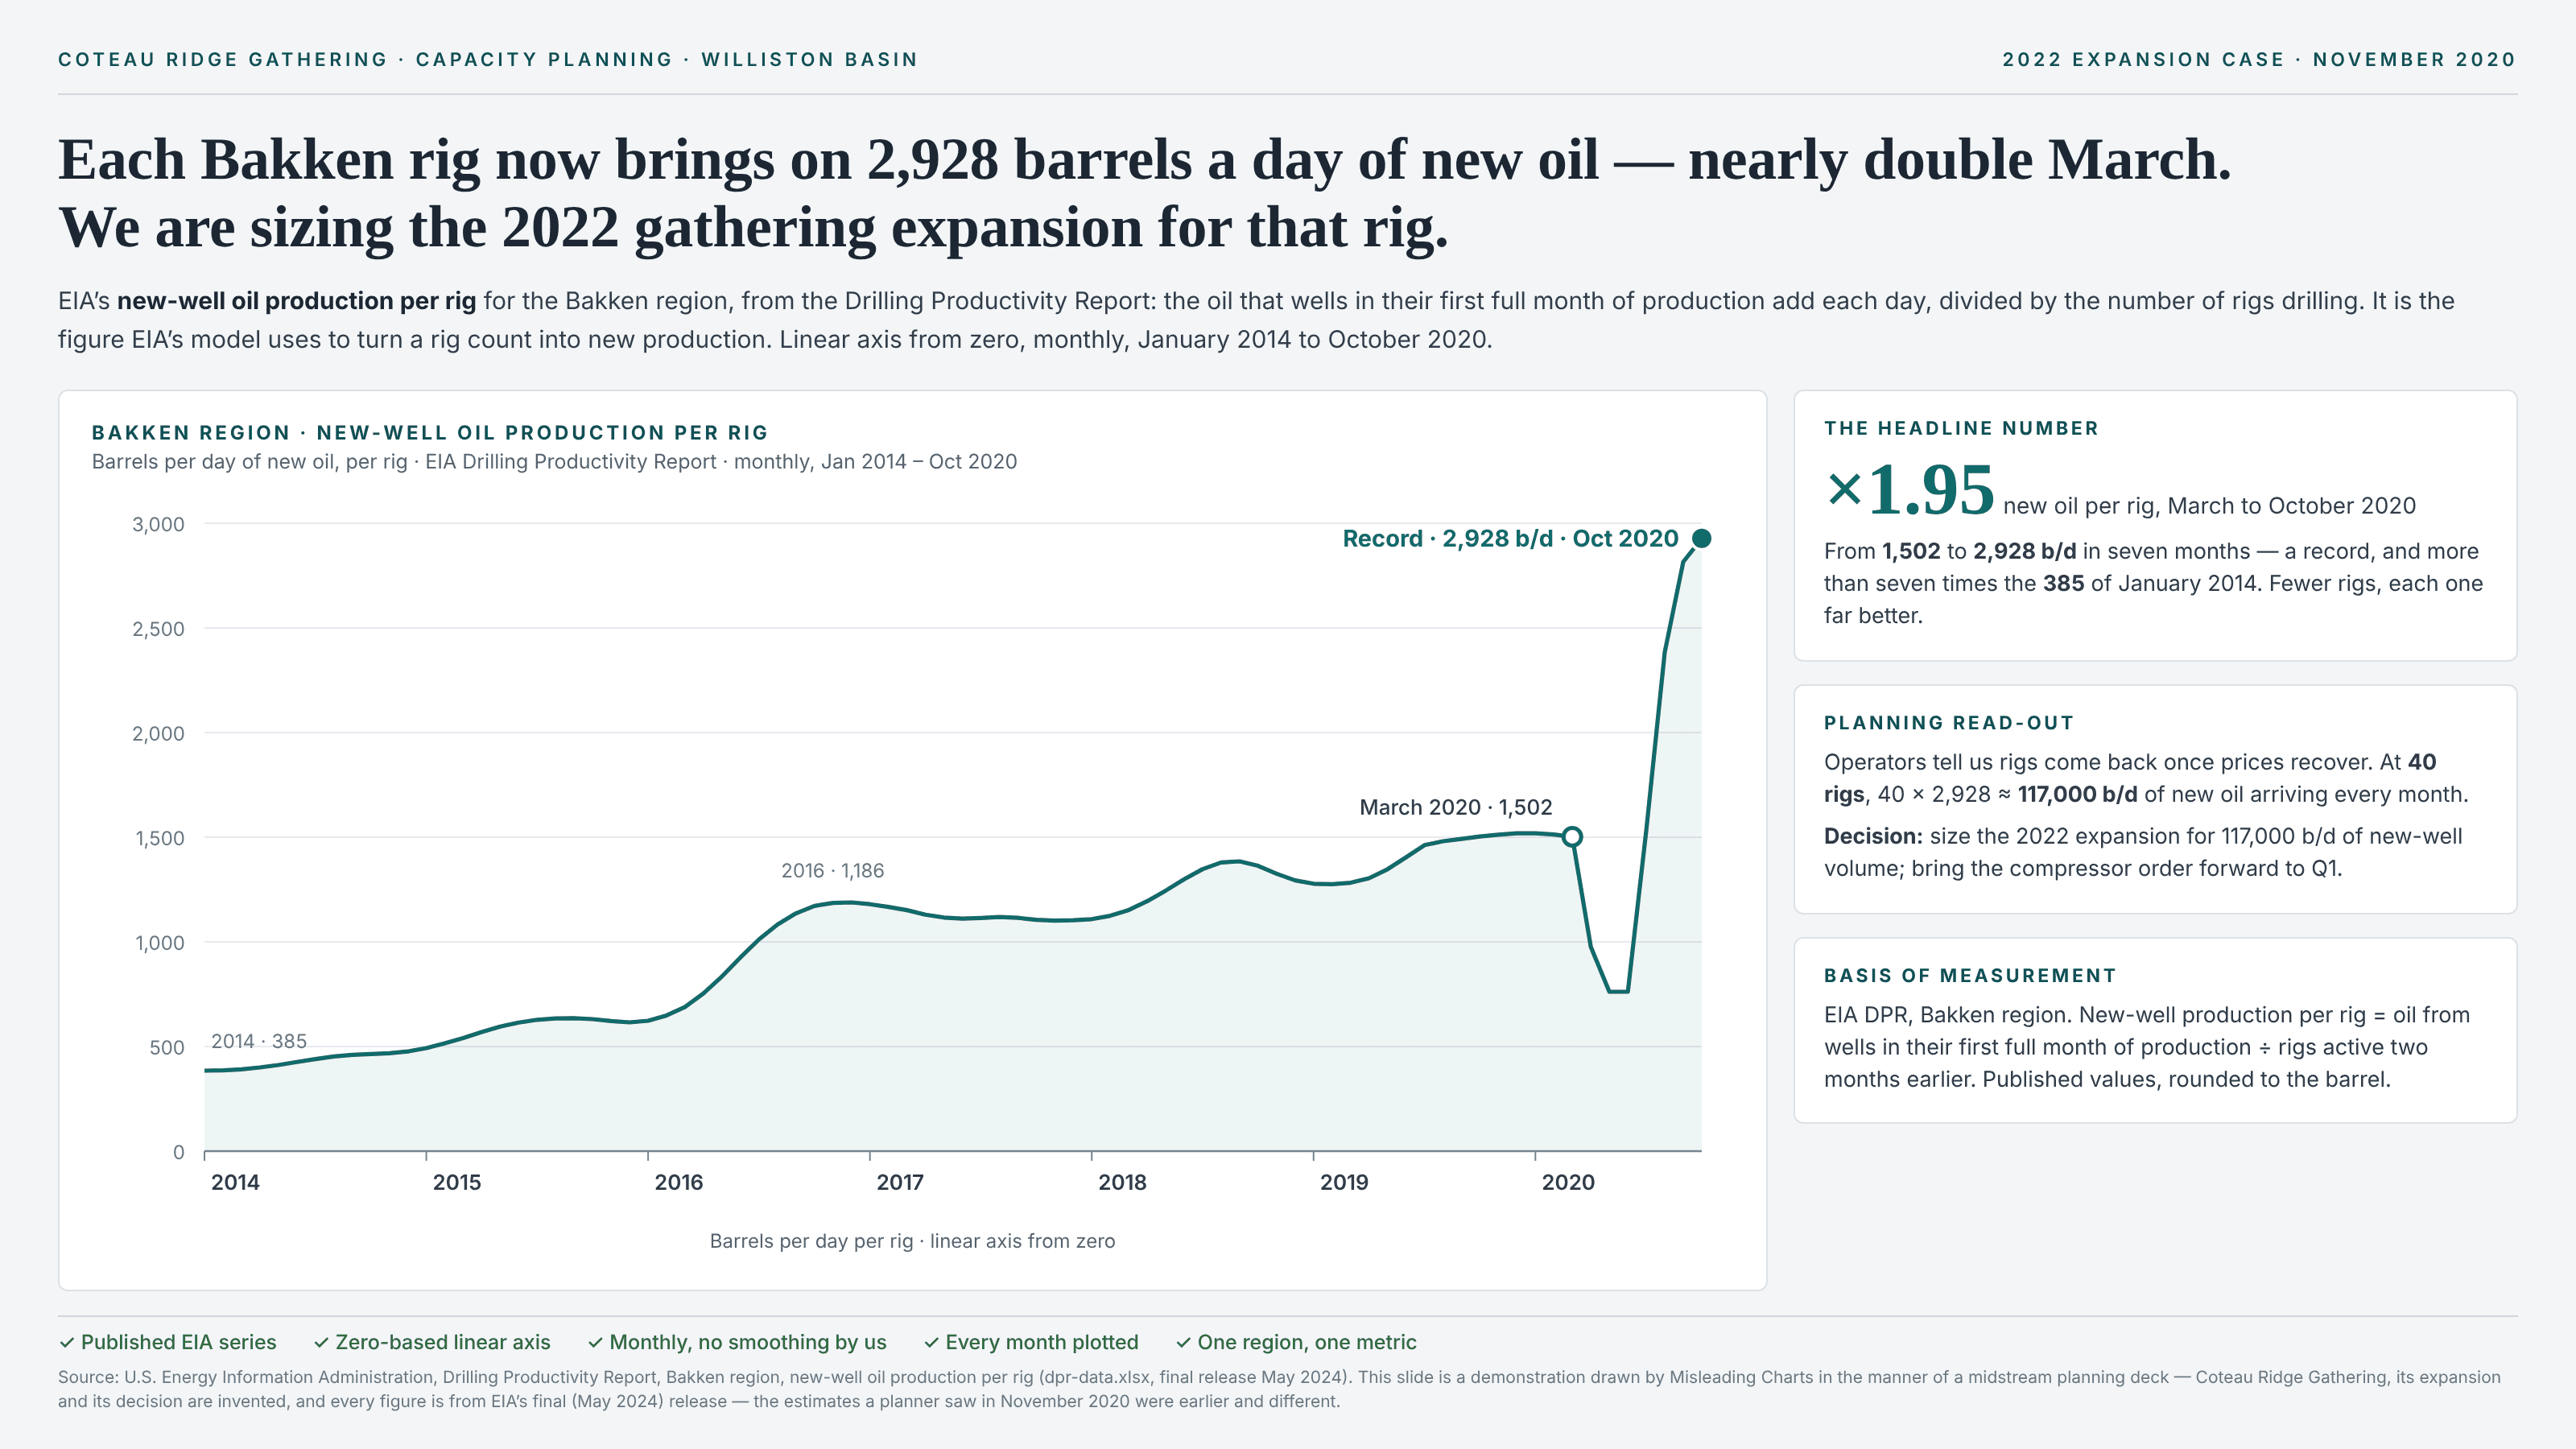
Cut the count and the per-unit figure climbs, even if no unit got any better.
a.k.a. high-grading · the per-head bump · revenue per employee after layoffs · sales per store after closures · production per rig · productivity in a downturn · the lagged numerator · the average of what was left
Per-rig, per-store, per-employee and per-acre figures are fractions, and a fraction moves when either half does. When the count underneath is cut hard, two things usually push the ratio up. The first is high-grading: the cut is not random. The weakest stores close first, the least productive staff go first, the rigs that stay drill the best ground, so the average of what is left is higher even if no single unit improved. The second is a lagged numerator: output already in the pipeline keeps arriving after the units that produced it have been counted out (orders booked before the layoff, wells drilled before the rig left), so the top of the fraction holds up while the bottom falls. Either way the chart shows a productivity surge and the reader takes it as a property of each unit, one they can multiply back up when the count recovers. It is not one, and the figure usually falls back as the count returns. It sits next to survivorship bias, which drops the failures from the dataset altogether. Here the failures are counted right up until the cut, and what changes is who is left in the denominator. It is not a late denominator either: nobody is dropped from the fraction by a rule about who counts. The count itself shrinks in the real world, and the ratio is then read as a property of each unit. Nor is it Simpson’s paradox: there is no reversal between pooled and grouped figures, just one ratio compared before and after a cut.
How to spot it
- A per-unit figure that jumps in the same months its own denominator collapses. Plot the count underneath beside it; if the two move in opposite directions, the ratio is mostly reporting the count.
- Ask whether the numerator went up at all. A record per head with a falling total is a smaller business divided by an even smaller headcount.
- Ask which units left. If it was the weakest ones — the worst stores, the marginal acreage, the newest hires — the average was always going to rise.
- Ask whether the output in the numerator was produced by the units in the denominator. Lags between doing the work and counting it (drilling and first production, selling and invoicing, enrolling and graduating) let output from departed units keep landing.
- Watch for a planning line that multiplies the peak ratio by a future count. A figure measured on the survivors of a cut does not describe the units that come back.
- Check what happened the last time the count recovered. A real per-unit gain survives the fleet growing again; a culled one fades.
The fix
Show both halves of the fraction on their own zero-based axes, aligned in time, with the ratio beneath them, so a rise that comes from the bottom falling is visible as exactly that. For a per-unit figure you can plan on, follow the same units through time, the way retailers quote same-store sales: output per well by the month it was drilled, revenue per employee among staff present in both periods, yield on the fields farmed both years. Where the lag matters, match the numerator to the units that actually produced it rather than to whoever is on the books this month. And when a ratio hits a record in the middle of a cut, say how much of the move came from the denominator before saying anything about productivity.
In the gallery