All techniques
Framing & context
The annualised run-rate
One good month, multiplied by twelve, quoted as a year.
a.k.a. run-rate · annual run-rate · ARR · MRR × 12 · annualised · annualized · on pace for · at this rate · best month times twelve · the summer month as a year
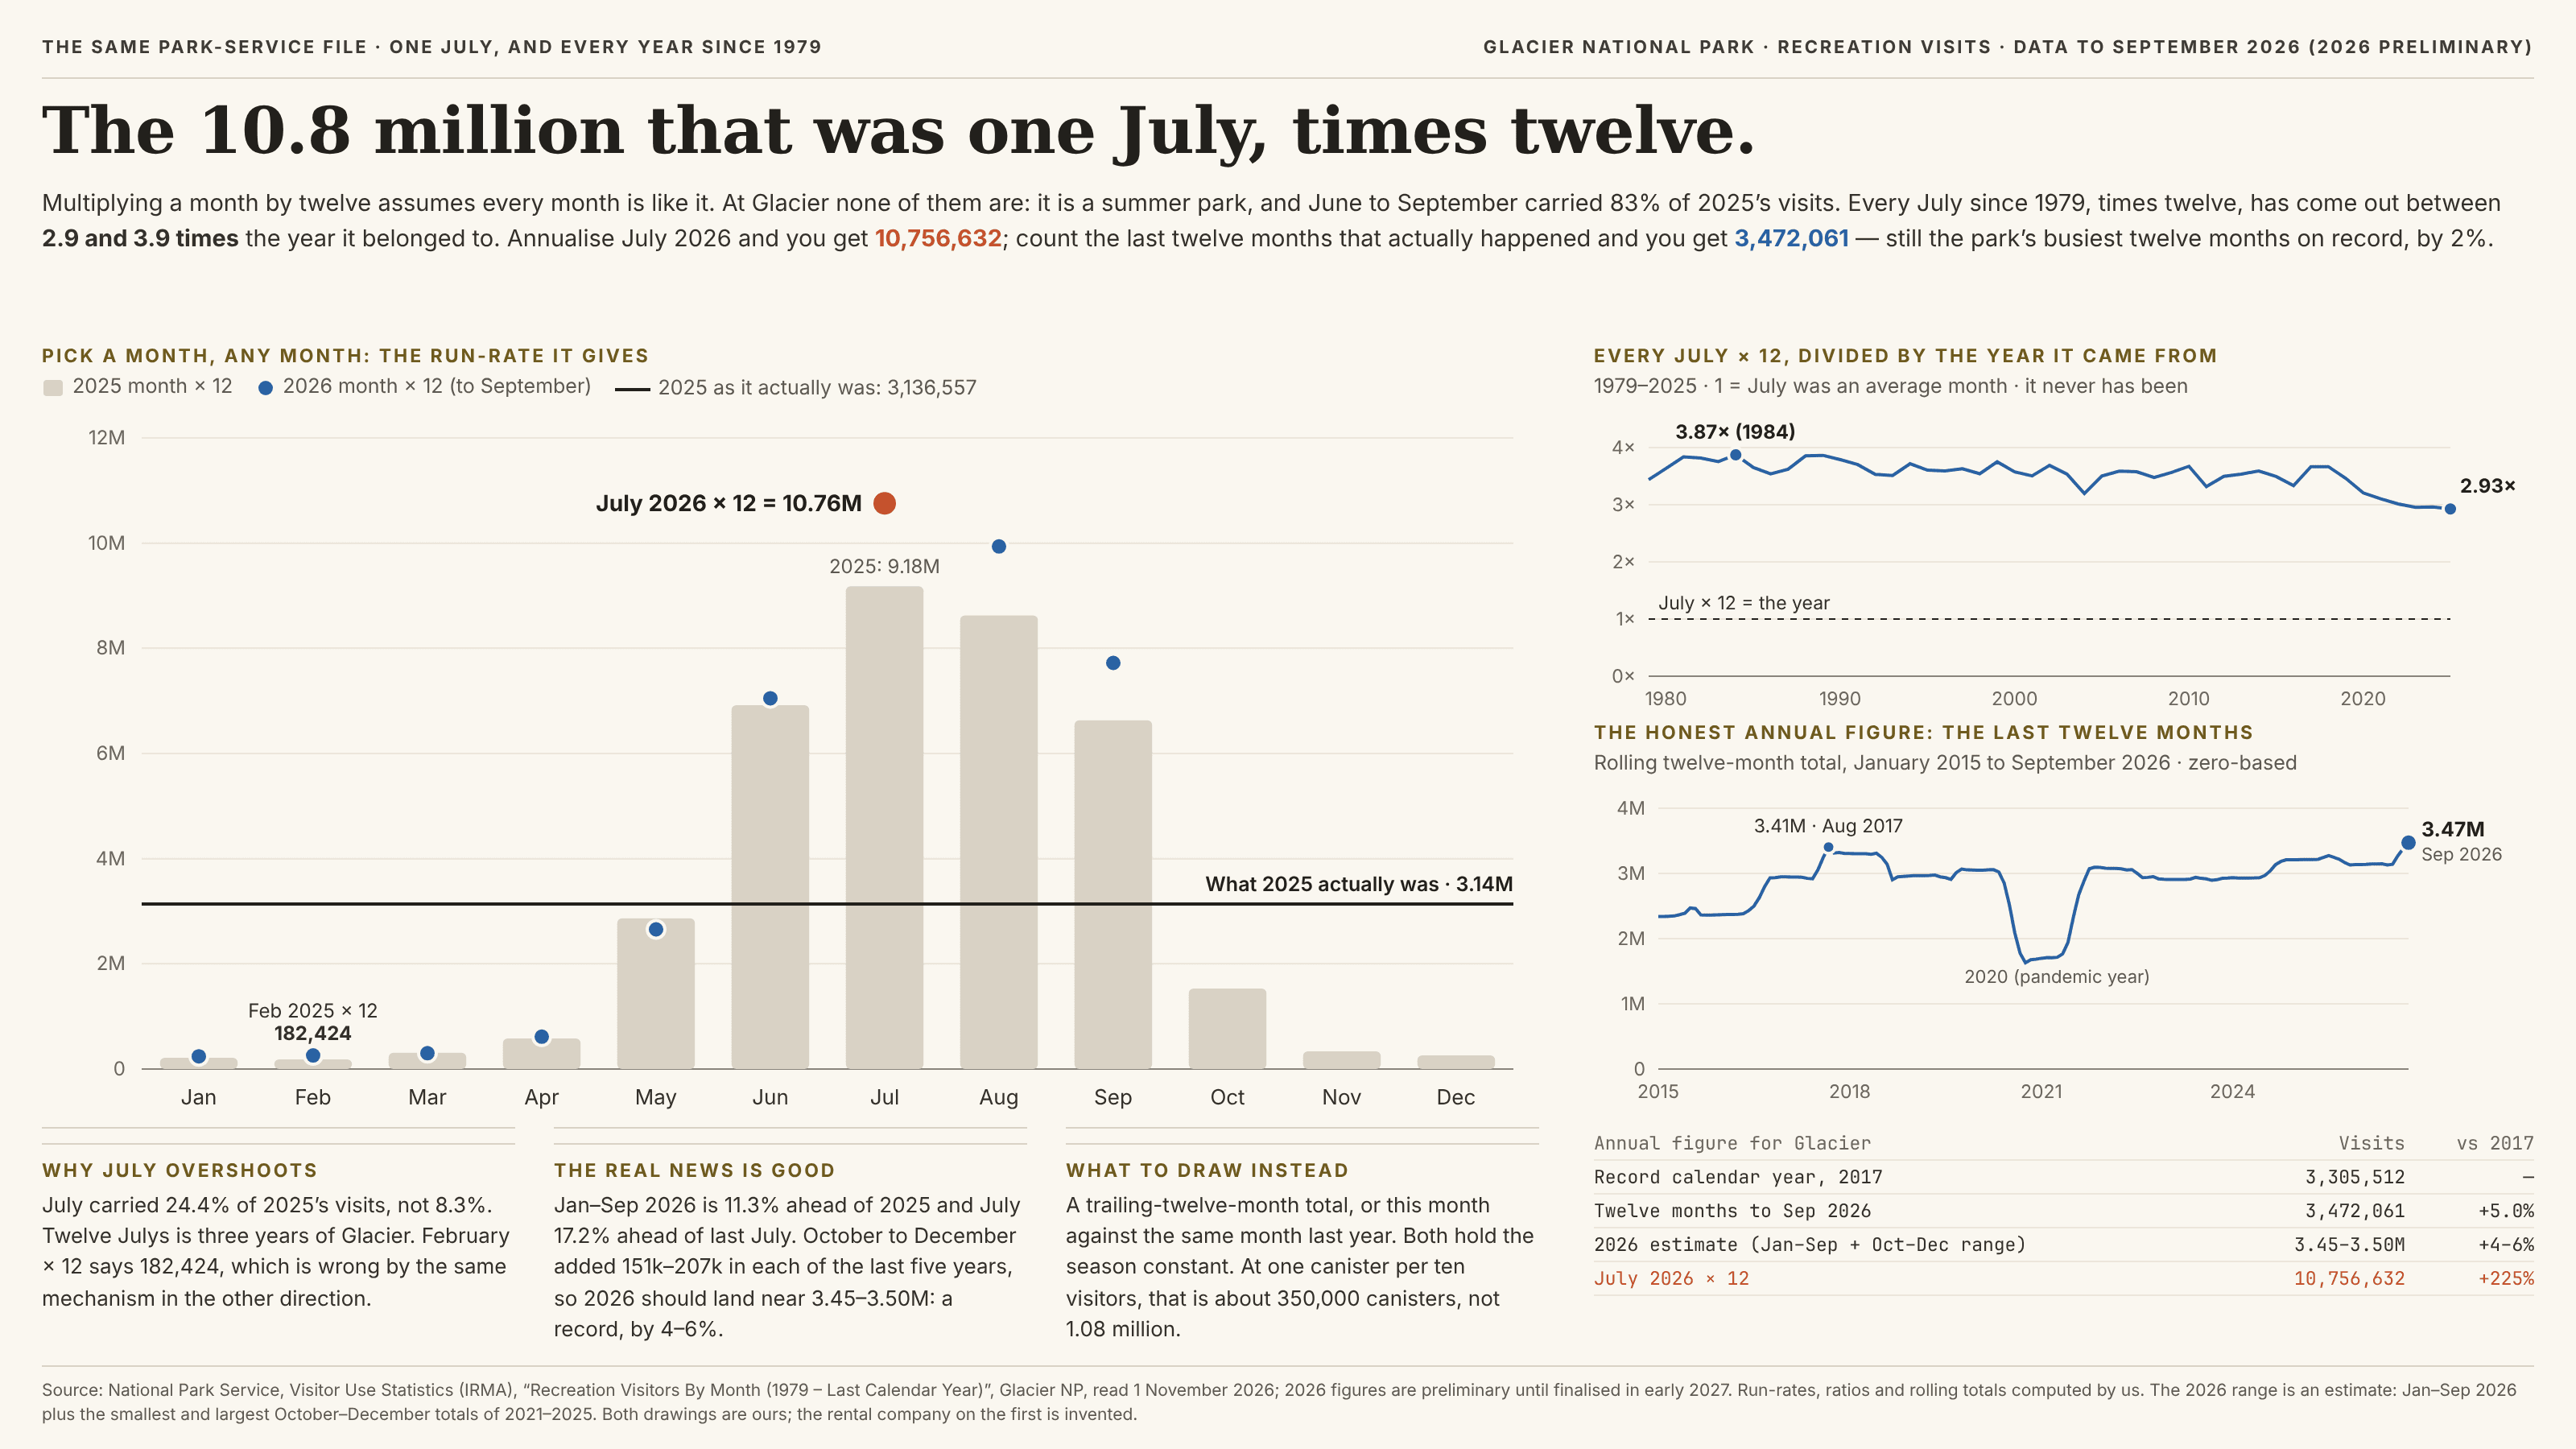
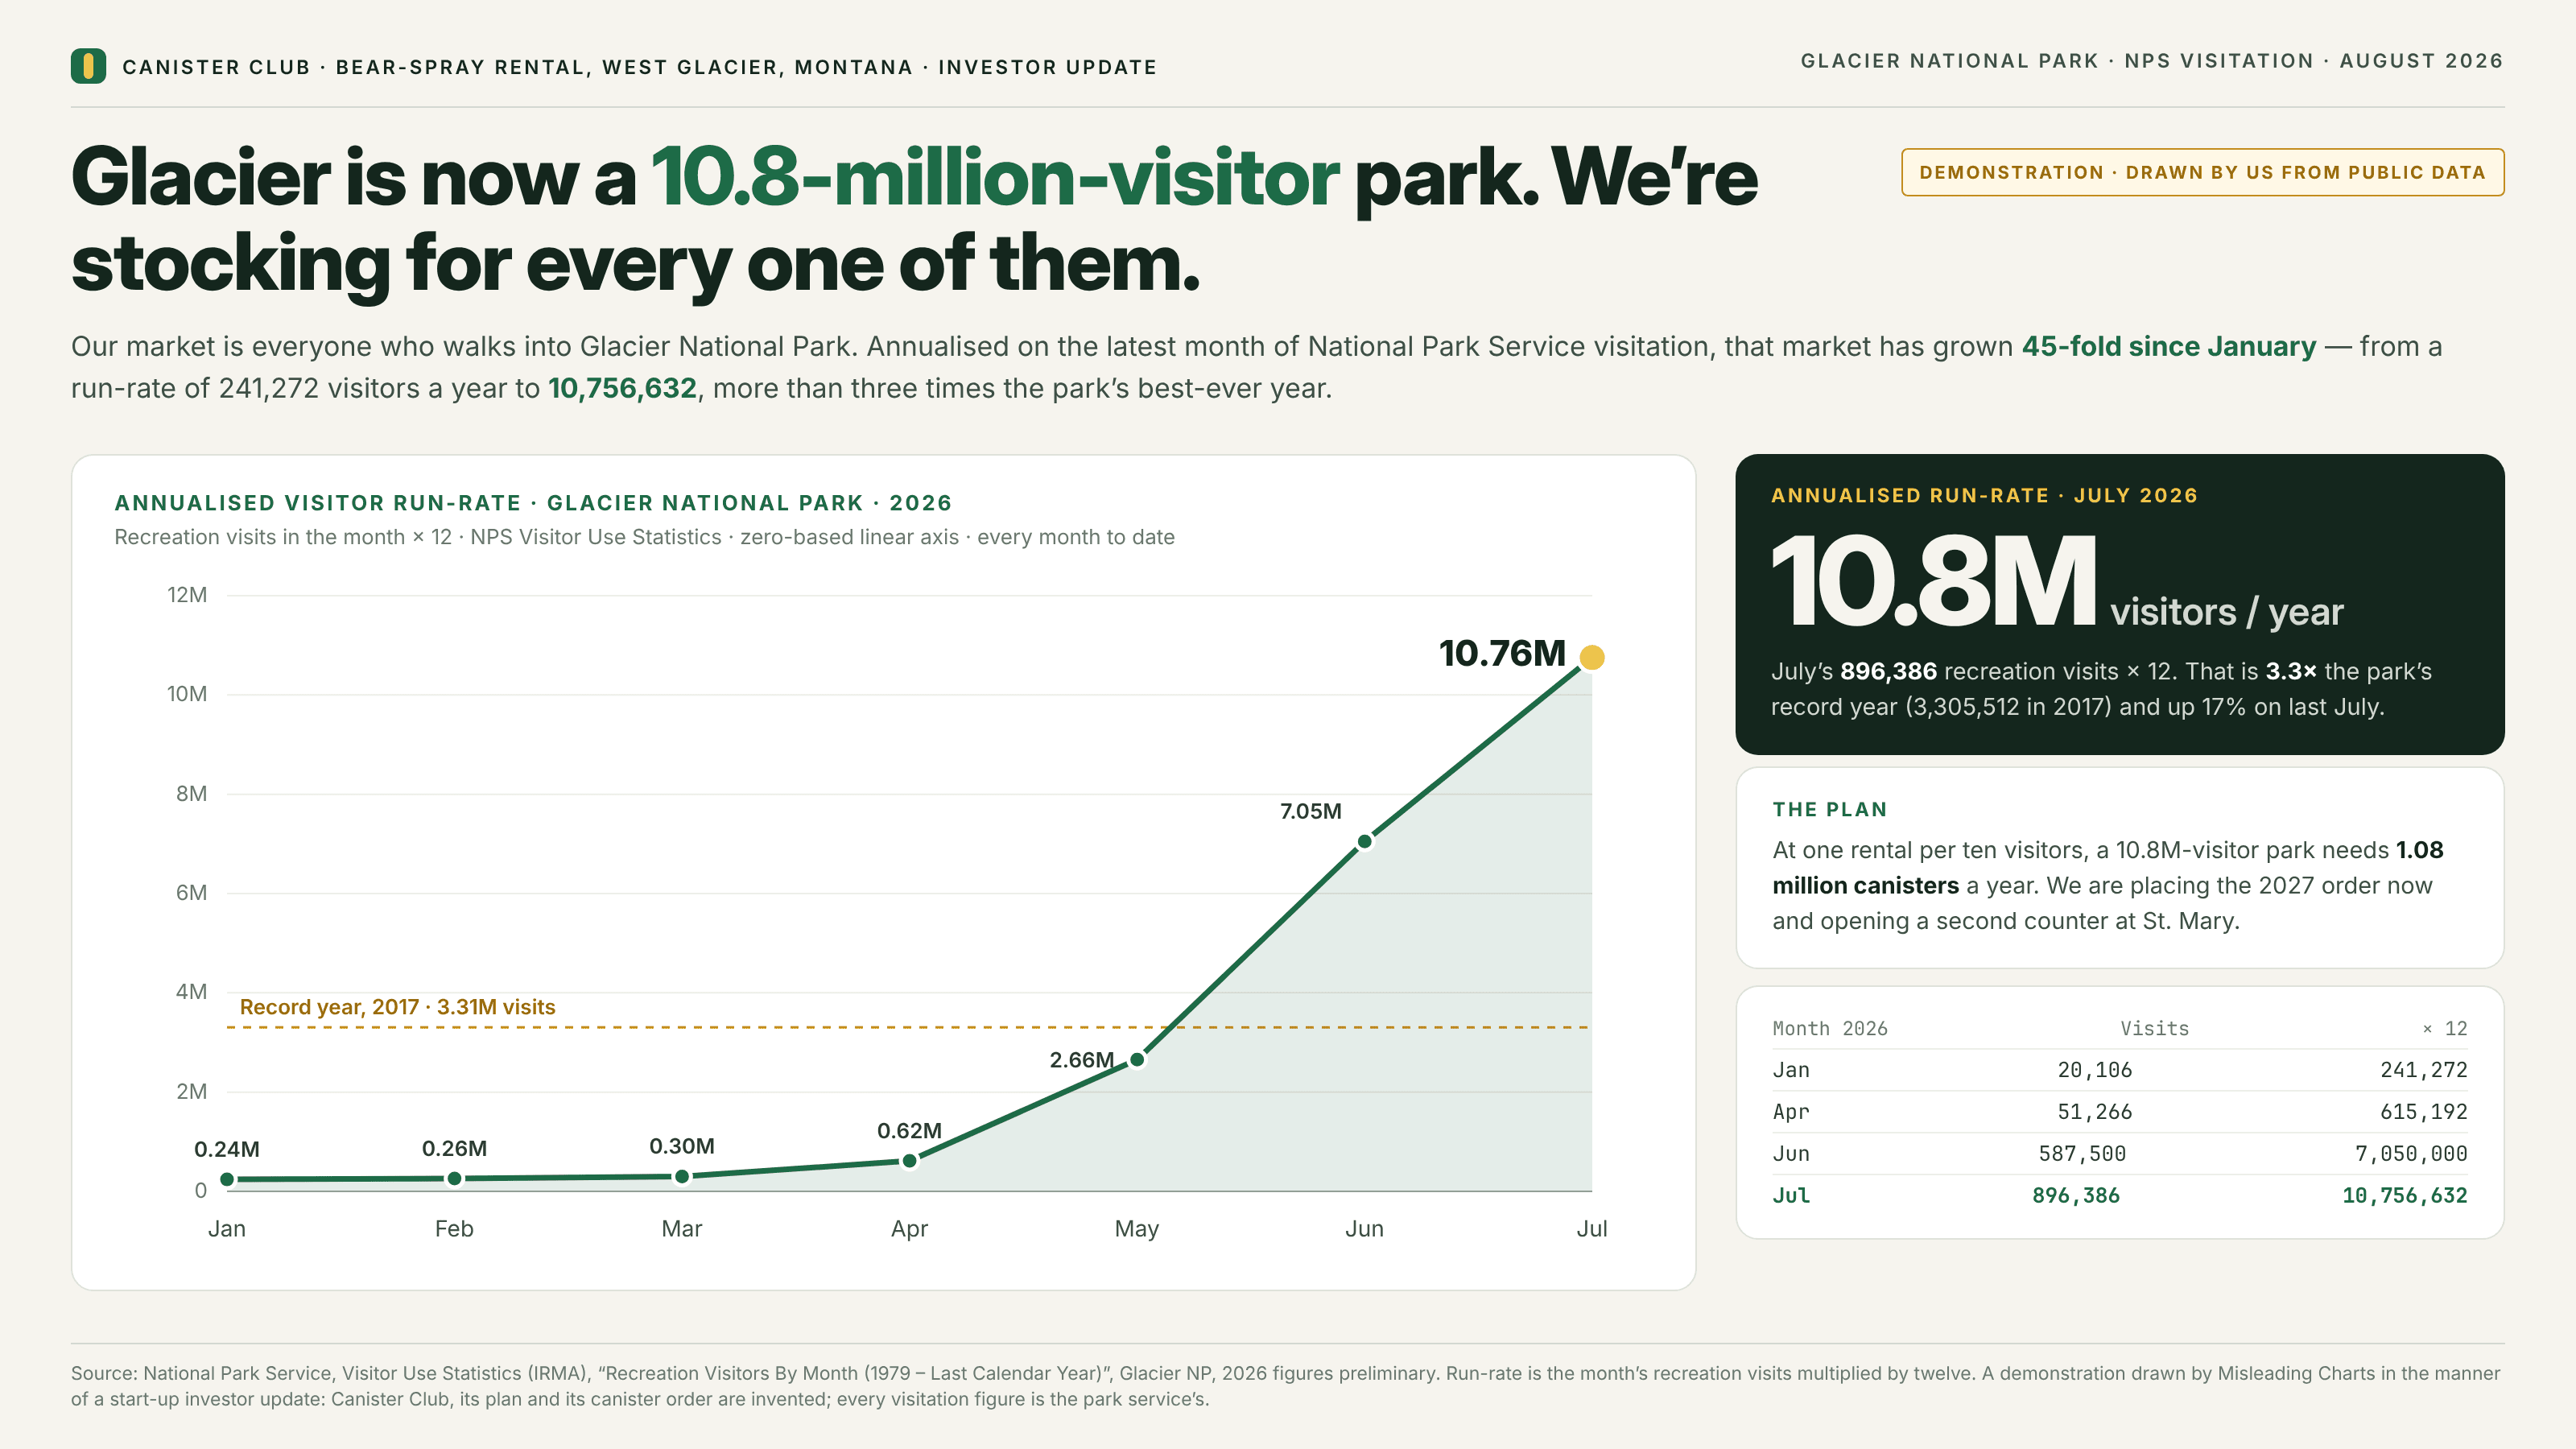
A run-rate takes a short stretch of time — a month, a week, a single day — and multiplies it up to a year. The arithmetic is honest, and the number sounds like a measurement: it carries a unit, a period and plenty of significant figures. What it quietly assumes is that every other stretch of the year will look like the one that was multiplied, and for almost anything with a season that is not true. Multiply a ski resort’s February, a toy shop’s December or a national park’s July by twelve and you get a year that has never happened, several times larger than any that has; multiply their quietest month and you get a collapse that is not happening either. The choice of month does all the work, and the month chosen is usually the latest one, which on a slide published in late summer or just after the holidays is the best one. Charted month by month, run-rates turn a season into a hockey stick: the line simply traces the calendar up the slope, and it reads as growth. Keep it apart from its neighbours. The unfinished period draws a partial period at full width, so its last bar is too short; here every month is complete and correctly counted, and the distortion is the multiplier. When a year-to-date total is scaled up to a full year, the run-rate is being offered as a cure for the unfinished period, and it has the same flaw: the months still to come are not average months. The seasonal swing compares adjacent months and reads the calendar as news; here one month is promoted to stand for all twelve. The extrapolated trend carries a fitted slope into the future; a run-rate fits nothing and projects nothing, and still describes a year nobody counted.
How to spot it
- The words “run-rate”, “annualised”, “on pace for”, “at this rate” or “× 12” anywhere near a headline number. Ask which stretch was multiplied, and by how much.
- Ask what share of a normal year the multiplied stretch usually holds. A month is a twelfth only on average; if it typically holds a quarter of the year, the run-rate is about three times too big, and if it holds a fiftieth it is about four times too small.
- A run-rate that lands far above the best actual year on record. A real year that large would be news in its own right; a multiplied month that large is usually the season.
- A month-by-month run-rate line shaped exactly like the calendar: flat in the off-season, steep into the peak. That is a seasonal pattern drawn on a growth axis.
- Check the date on the slide. Run-rates tend to appear just after the strongest month and quietly vanish after the weakest.
- Subscriptions are the partial exception. Monthly recurring revenue × 12 is a reasonable statement about contracts already signed, provided churn is low and billing is not seasonal; it becomes this trick when one-off or seasonal revenue is folded into the month that gets multiplied.
The fix
Report a year that actually happened. A trailing-twelve-month total covers every season exactly once, needs no assumption, and moves every month, so it answers “how big are we now?” without waiting for December. To show momentum, compare the month with the same month a year earlier, which holds the season constant. If a forward annual figure is genuinely needed, scale the months you have by the share of the year those months have historically held, say which years the shares came from, and print the result as a range rather than a single number. And if a run-rate must appear at all, print the stretch it was taken from beside it — “July × 12” — so a reader who knows the business can do the correction in their head.
In the gallery