All techniques
Size & scale
The acreage choropleth
The data picks the colour. The land decides how much of it you see.
a.k.a. filled map · shaded map · land-area bias · the big-empty-state problem · colouring by region · acres, not amounts
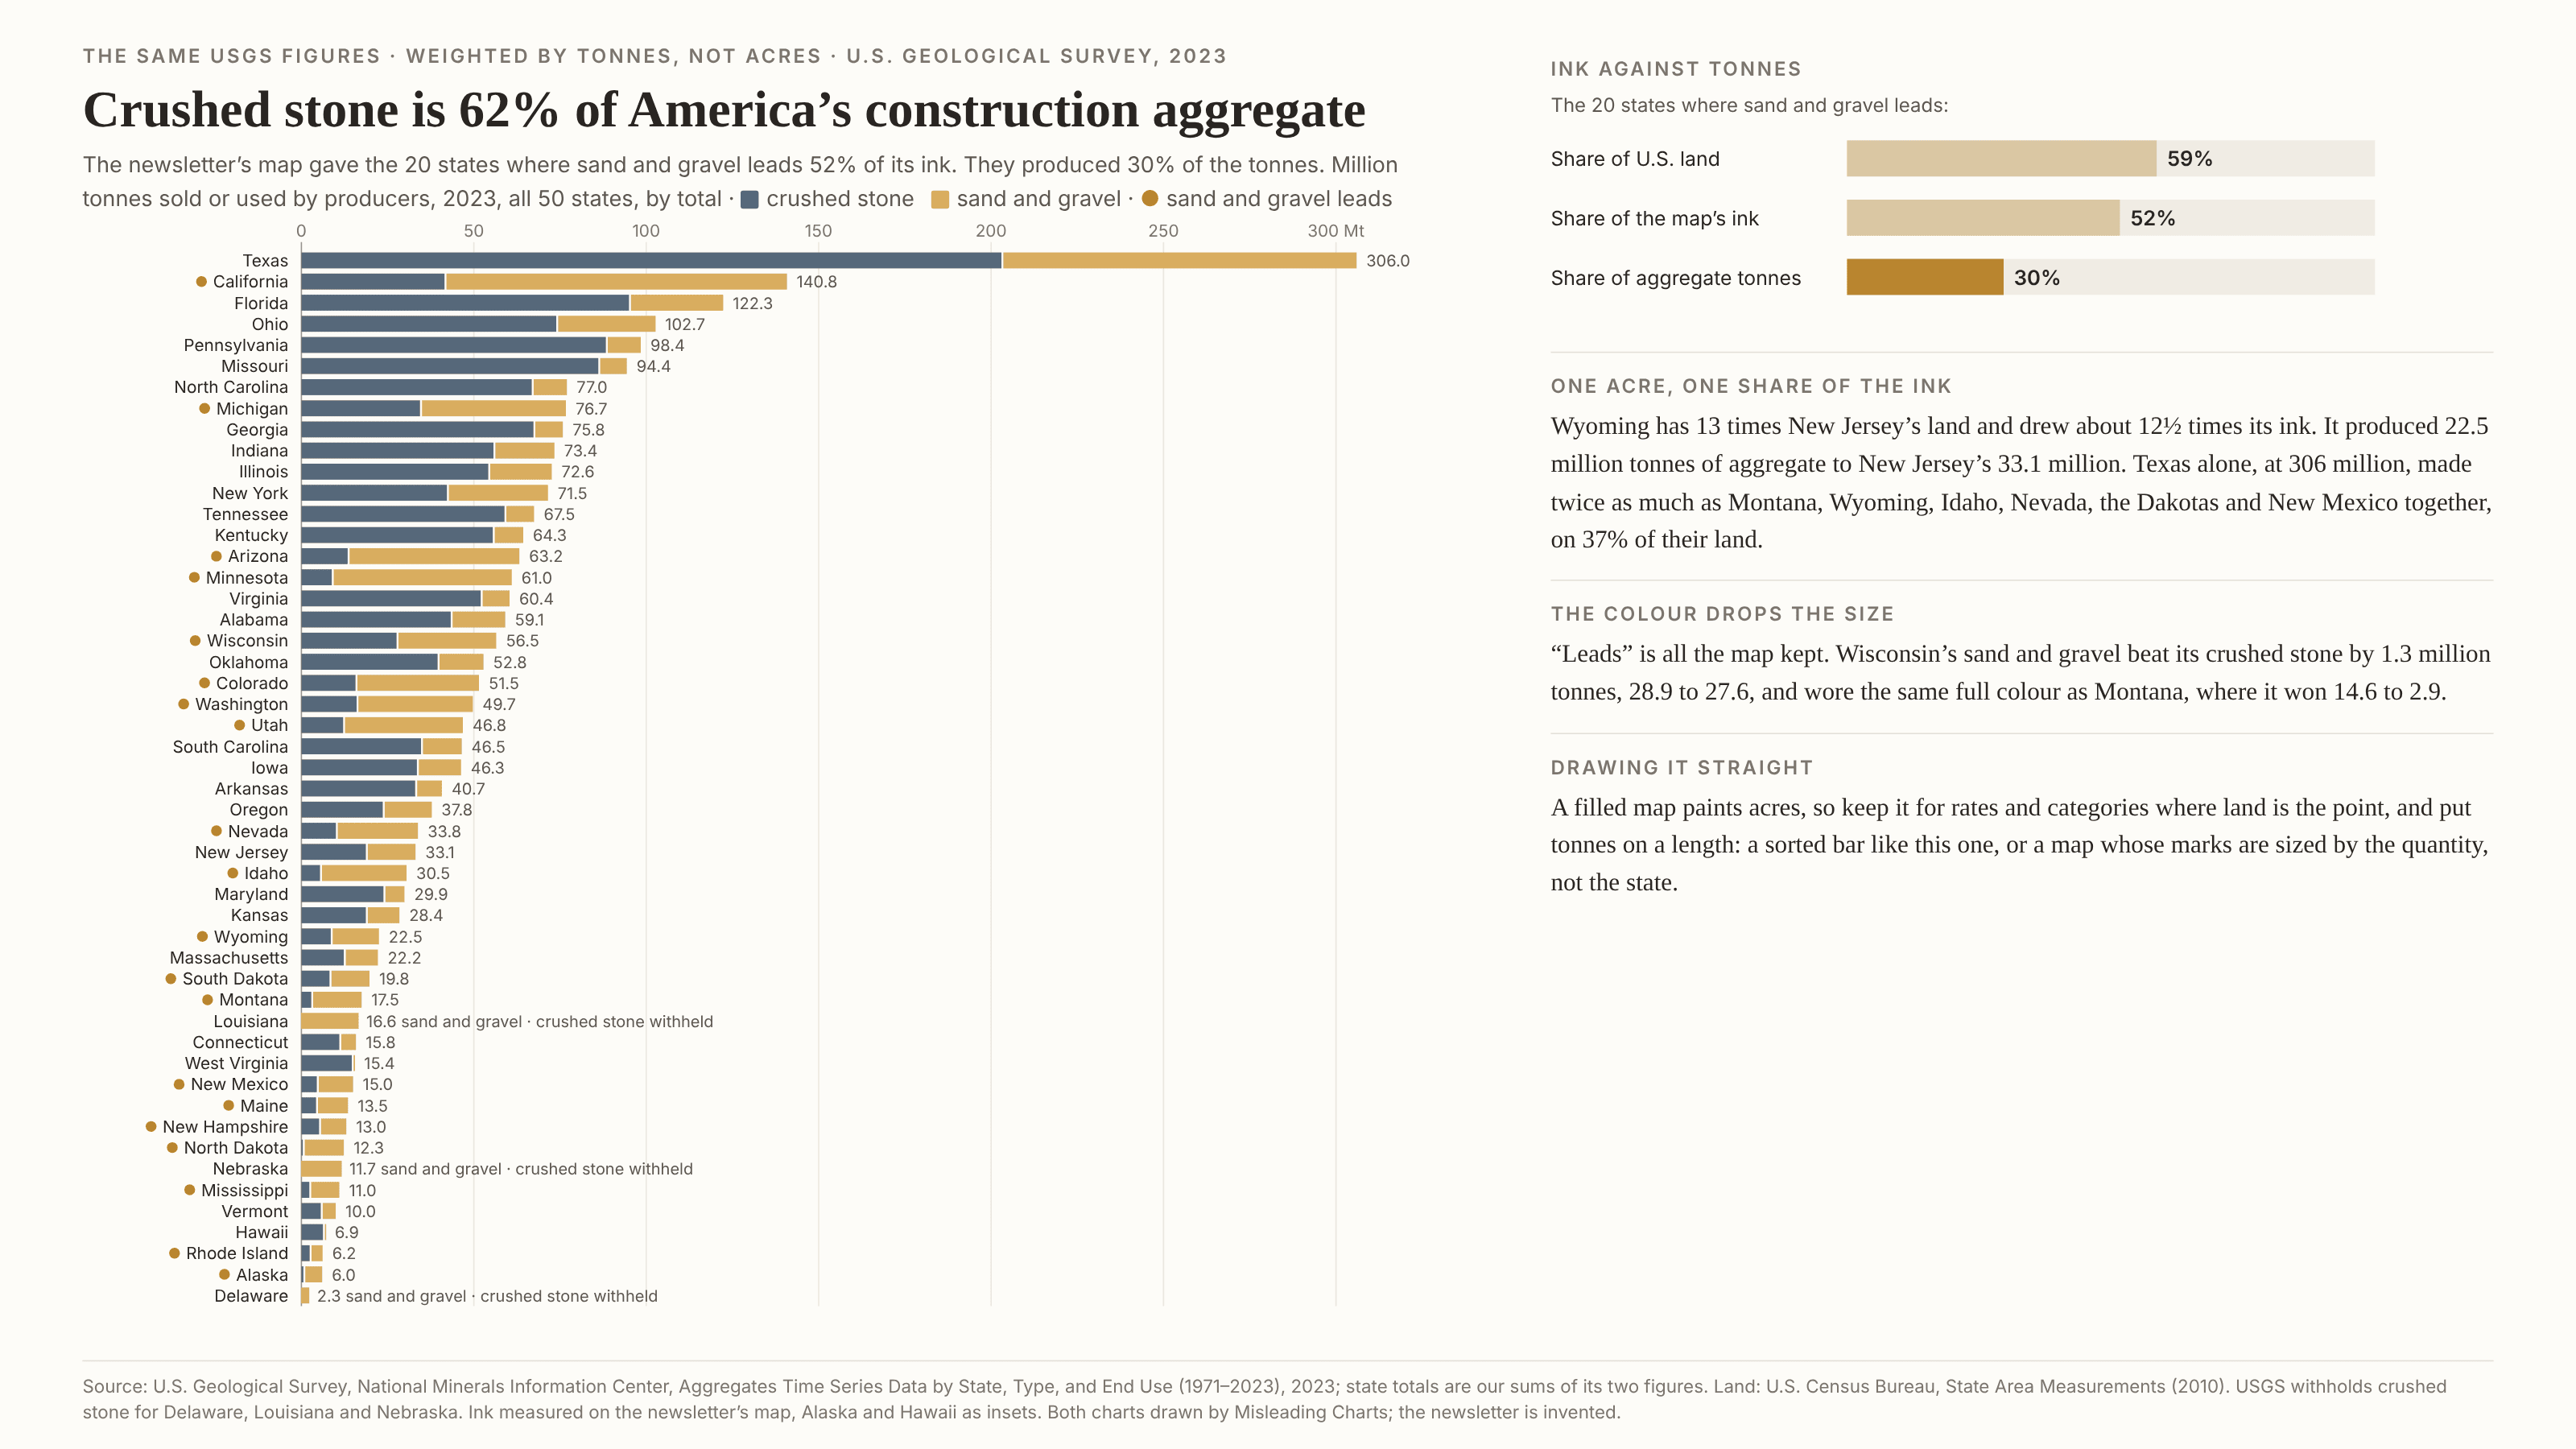
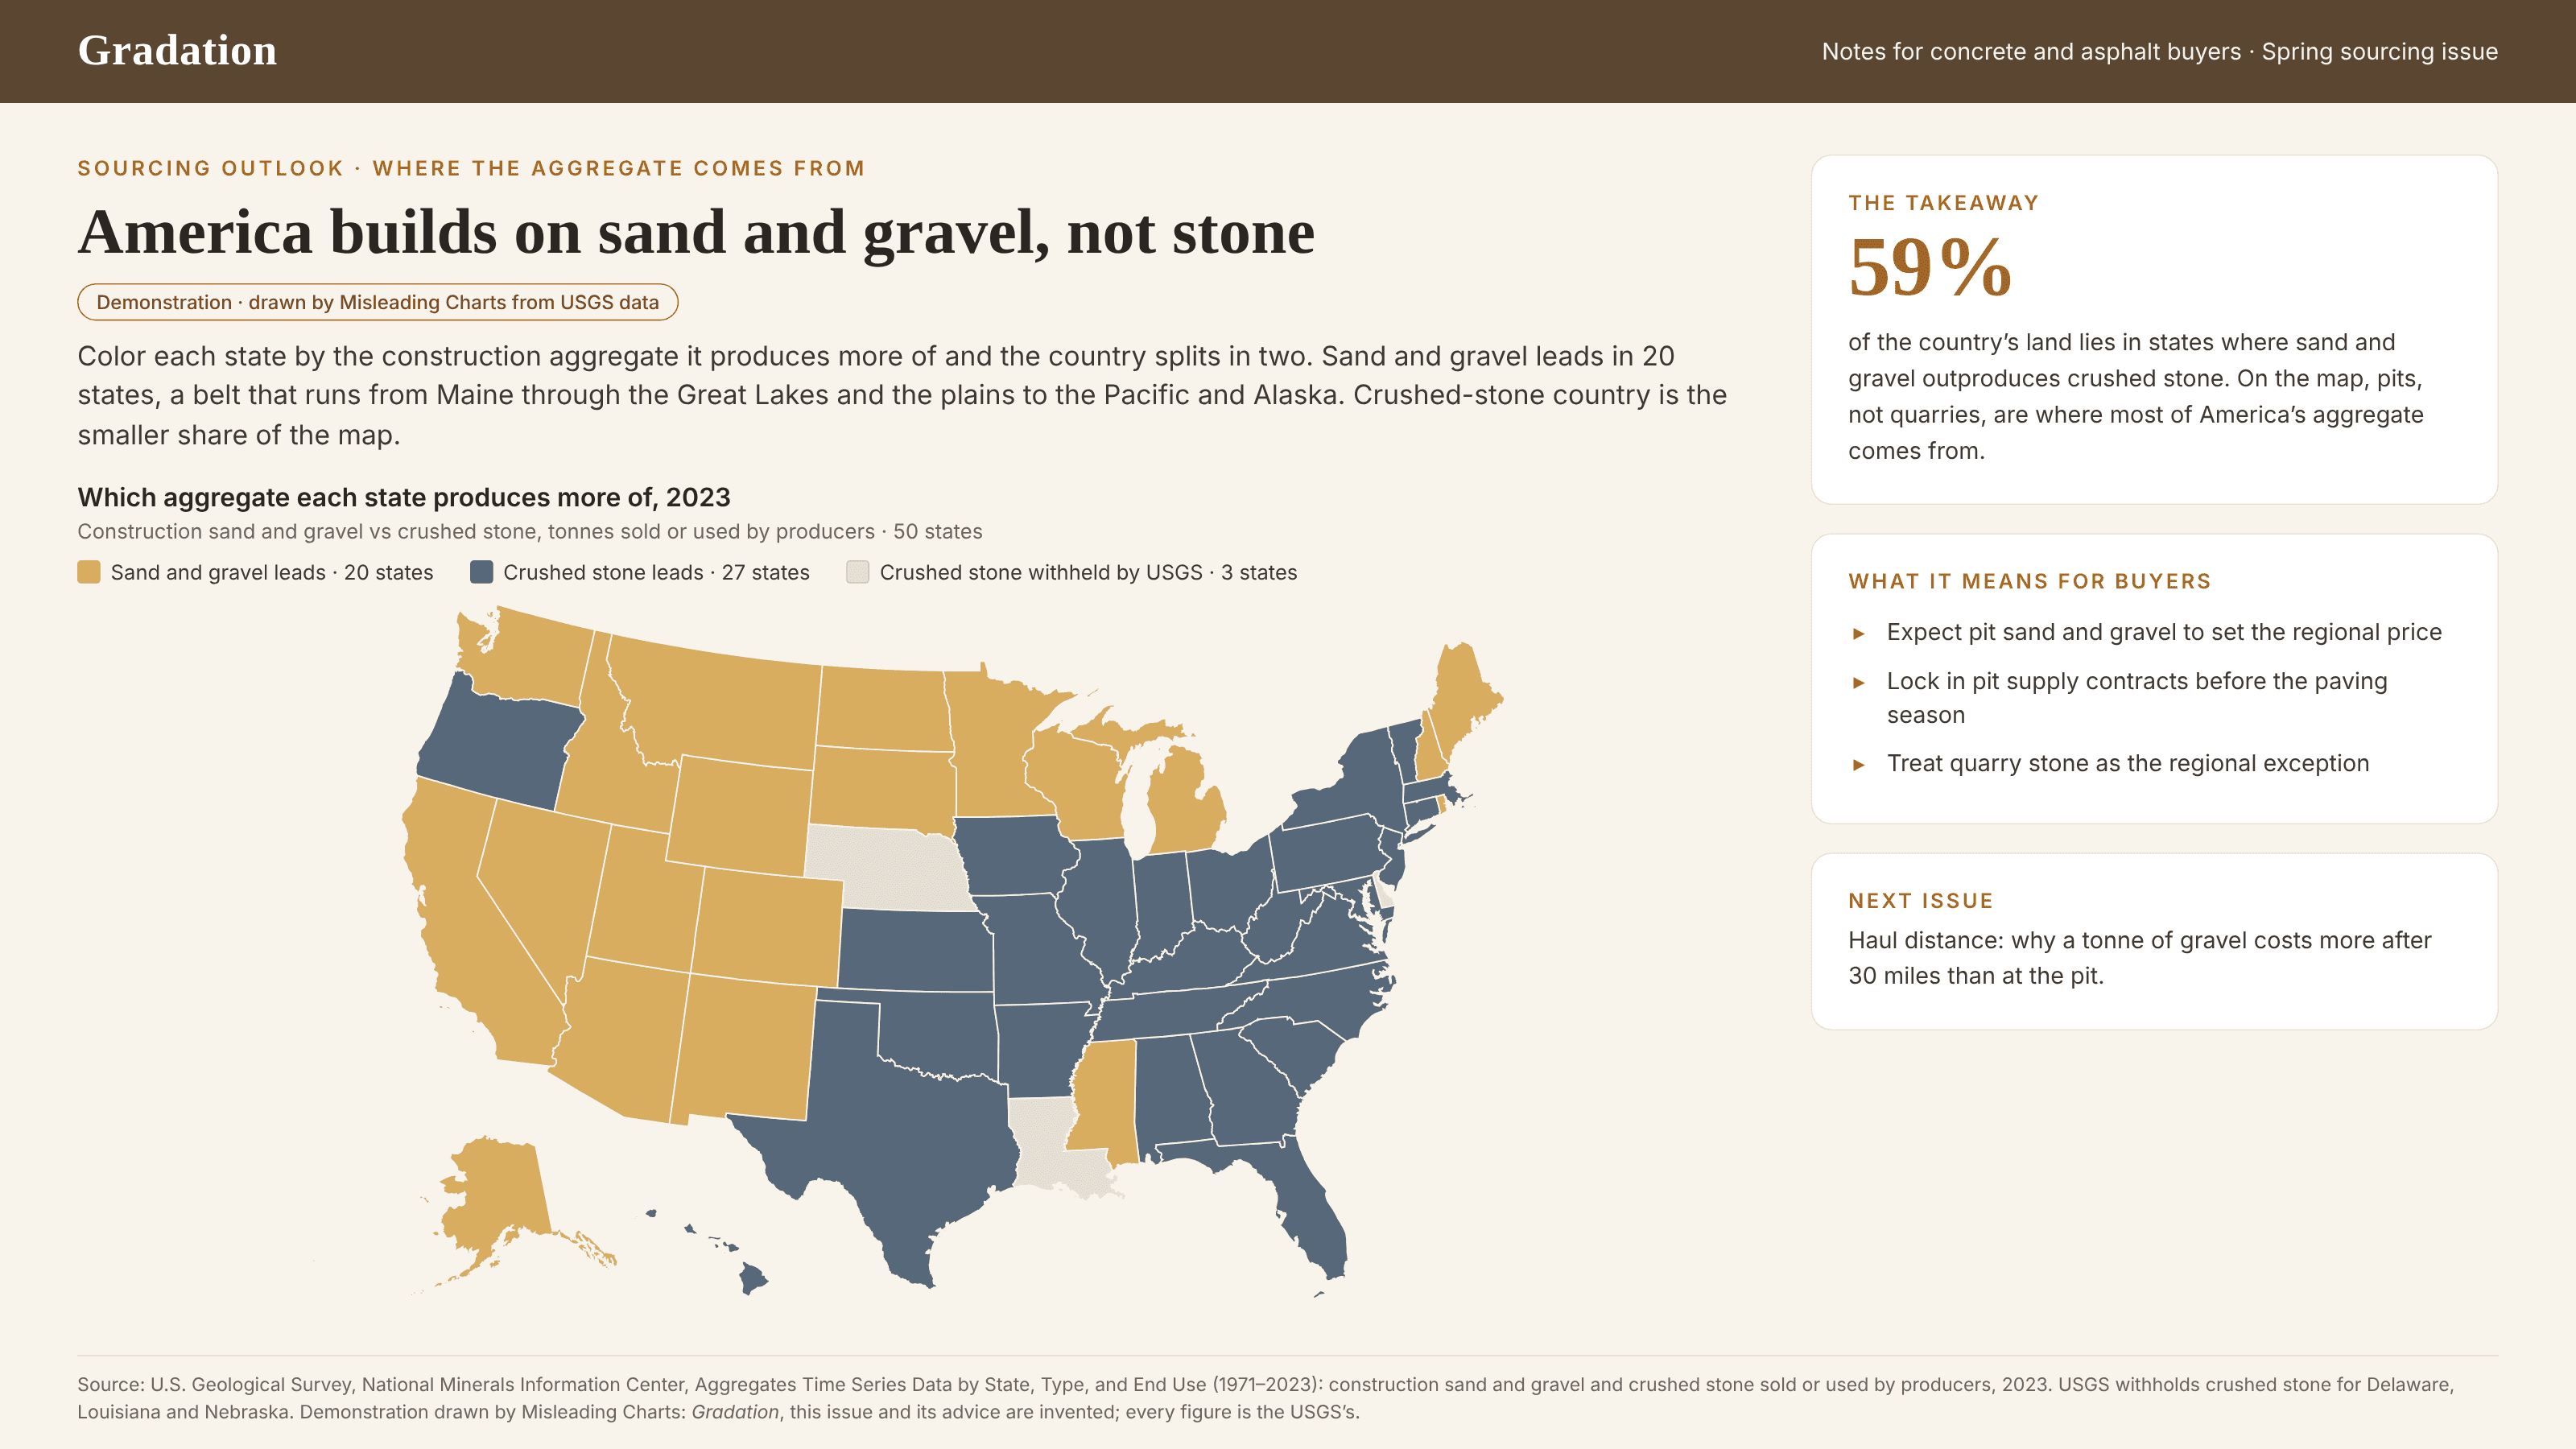
A choropleth fills each region with a colour taken from its value, and then the region’s outline decides how much of that colour reaches the page. The value sets the hue; the acreage sets the ink. Montana gets more than a hundred times Rhode Island’s share of the picture whatever the number says, so a wide, empty region and a small, busy one that land in the same bin weigh very differently in the overall impression. That is harmless when land is what the question is about, and wrong when the quantity lives in tonnes, people or dollars, which do not spread themselves out by the square mile. It gets worse when the colour is a category, such as which product leads or which supplier is biggest, because a category also throws away size: a region that won by a sliver and one that won by a mile wear the same full colour. The reader then judges the country by the share of the map each colour covers, which measures territory, not output. It is a cousin of the area illusion: the eye reads ink, but here the ink comes from geography rather than from anyone’s scaling, which is why it rarely looks like a choice. Unlike the map projection, the map itself can be perfectly equal-area; the land is drawn true, it just is not the thing being counted.
How to spot it
- Ask what the colour measures and what the area measures. If the colour is a quantity of things and the area is land, the impression is weighted by land.
- Watch for “most of the map” in the copy. A share of the map is a share of acres, and it is almost never the share of the total the headline implies.
- Find the biggest region in a bin and the smallest region in the other. If the small one produces more, the map has already misled anyone glancing at it.
- A categorical fill such as “leads”, “winner” or “majority” throws away the margin. Look for regions that only just made the cut.
- Notice the insets. Alaska is usually shrunk to a fraction of its size and Hawaii moved and sometimes resized, so even the acreage on the page is not consistent.
- Check whether the value is a rate or a total. A rate per person or per square mile can be fair on a filled map; a raw total on a filled map is a picture of acreage (see also the missing denominator).
The fix
If the question is how much, put the quantity on a length: a sorted bar chart, one row per region, split into its parts where the parts matter. If the geography matters too, draw a map whose marks scale with the quantity, not with the land: proportional symbols placed on each region, a dot density map, or a cartogram. An equal-tile grid map is a good middle step; it gives every region the same ink, which is honest about the colour but still does not show size, so print the numbers on it. Keep the filled map for rates and categories where land is the point, and when you do, say in the caption that area means acreage, and add a small bar of the real totals beside it so nobody has to estimate shares from shapes.
In the gallery